HOUSTON, TX – March 23, 2023 – Itafos Inc. (TSX-V: IFOS) (the “Company”) reported today its Q4 and FY 2022 financial and operational highlights. The Company’s financial statements and management’s discussion and analysis and annual information form for the year ended December 31, 2022 are available under the Company’s profile at www.sedar.com and on the Company’s website at www.itafos.com. All figures are in thousands of US Dollars except as otherwise noted.
CEO Commentary
“We are pleased to report record safety performance and financial results for 2022. The 2022 reported revenues of $593.3 million and adjusted EBITDA of $224.8 million were supported by strong production performance at our Conda facility and improved market fundamentals for the agricultural sector.”
“Over the last 24 months we have successfully executed on our stated business objectives and implemented solutions which have strengthened the Company for the future. Included among those accomplishments were deploying strong free cash flow toward deleveraging, including two debt refinancings which have significantly reduced the Company’s net debt at the end of 2022 to $88.3 million, a $129.4 million reduction from the prior year-end. We have positioned Itafos for the next phase of sustainable growth with the planned extension of the Conda (H1/NDR) mine-life through 2037. Following the publication of the Final Environmental Impact Statement in November, we continue to advance the H1/NDR mine-life extension approval process, working collaboratively with the relevant regulatory agencies, and expect a decision in the coming months with capital work commencing soon thereafter.”
“As a result of the significant progress made over the last two years, the Company announced on March 13, 2023 that the Board has formed a committee of independent directors to explore and evaluate various strategic alternatives. The board believes that this is an appropriate time to consider the full range of potential alternatives to enhance value for all Itafos shareholders.” said G. David Delaney, CEO of Itafos.
Q4 2022 Key Highlights
- revenues of $135.2 million
- adjusted EBITDA of $50.1 million(1)
- net income of $29.3 million
- basic earnings of C$0.21/share
- free cash flow of $38.6 million(1)
FY 2022 Key Highlights
- revenues of $593.3 million
- adjusted EBITDA of $224.8 million(1)
- net income of $114.7 million
- basic earnings of C$0.79/share
- free cash flow of $187.9 million(1)
December 31, 2022 Key Highlights
- trailing 12 months adjusted EBITDA of $224.8 million(1)
- net debt of $88.3 million(1)
- net leverage ratio of 0.4x (1)
FY 2023 Guidance
- adjusted EBITDA guidance of $140 to $180 million(1)
- net income guidance of $35 to $65 million
- basic earnings guidance of C$0.25 to $0.45/share
- maintenance capex guidance of $15 to 25 million(1)
- growth capex guidance of $40 to 50 million(1)
- free cash flow guidance of $70 to $100 million(1)
1 Adjusted EBITDA, trailing 12 months adjusted EBITDA, maintenance capex, growth capex, net debt, net leverage ratio and free cash flow are each a non-International Financial Reporting Standards (“IFRS”) financial measure. For additional information on non-IFRS and other financial measures, see “Non-IFRS financial measures” below.
Q4 and FY 2022 Market Highlights
Diammonium phosphate (“DAP”) New Orleans (“NOLA”) prices averaged $672/short ton (“st”) in Q4 2022 compared to $715/st in Q4 2021, down 6% year-over-year. Although prices are marginally below the comparative period last year, pricing remains elevated relative to historical norms. DAP NOLA prices averaged $772/st in FY 2022 compared to $602/st in FY 2021, up 28% year-over-year.
Specific factors impacting DAP NOLA prices were as follows:
- limited phosphate capacity additions;
- multi-year low stocks-to-use ratios for global coarse grains and oilseeds supporting fertilizer relative affordability;
- historically high crop prices in 2022;
- the breakout of war in Ukraine; and
- continued restrictions and controls on exports of phosphate from China.
Q4 2022 Financial Highlights
For Q4 2022, the Company’s financial highlights were as follows:
- revenues of $135.2 million in Q4 2022 compared to $116.8 million in Q4 2021;
- adjusted EBITDA of $50.1 million in Q4 2022 compared to $47.9 million in Q4 2021;
- net income of $29.3 million in Q4 2022 compared to $24.3 million in Q4 2021;
- basic earnings of C$0.21/share in Q4 2022 compared to C$0.16/share in Q4 2021; and
- free cash flow of $38.6 million in Q4 2022 compared to $28.8 million in Q4 2021.
The increase in the Company’s Q4 2022 financial performance compared to Q4 2021 was primarily due to higher realized MAP prices (priced on a three-month lag under the terms of the MAP offtake agreement) and sales volumes at Conda, which were partially offset by higher input costs. The increase in net income was primarily due to lower finance and income tax expenses.
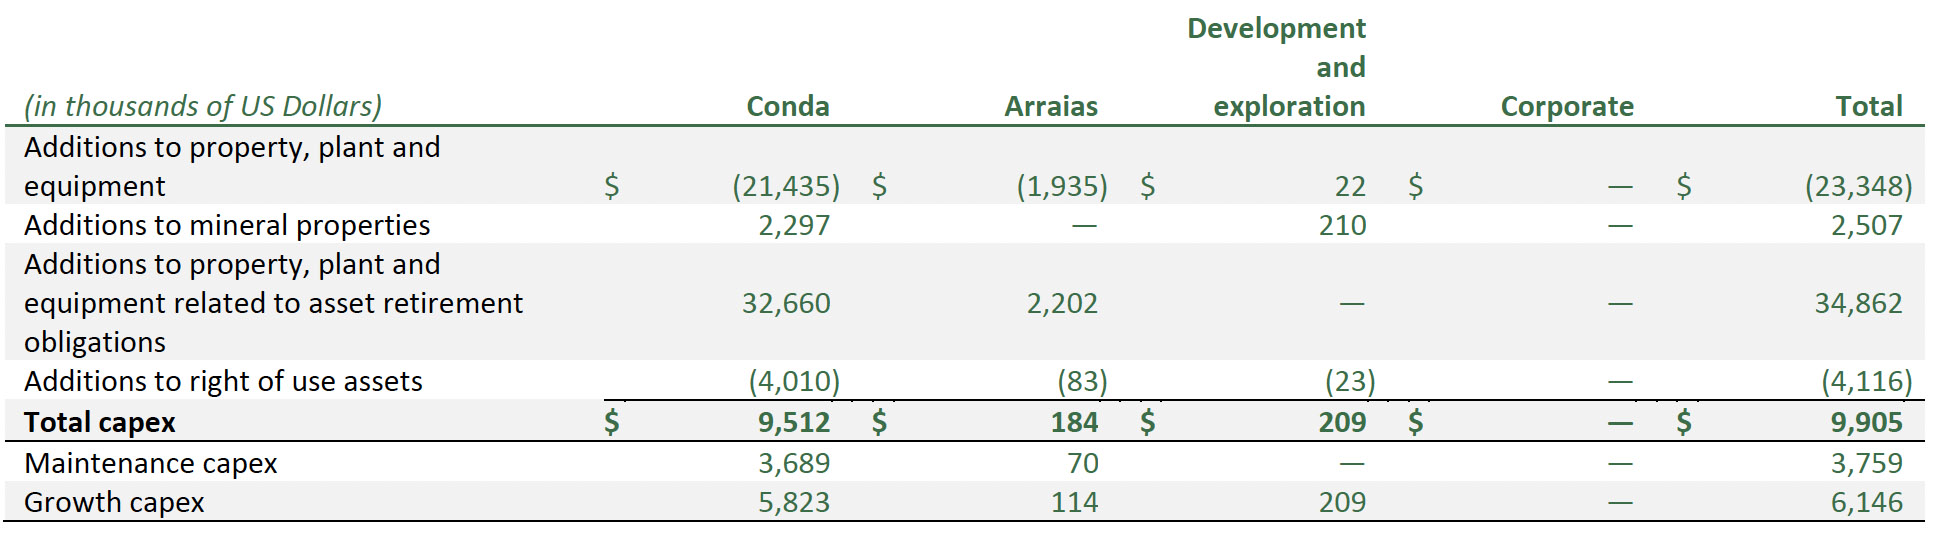
The Company’s total capex(2) spend in Q4 2022 was $9.9 million compared to $6.3 million in Q4 2021 with the increase primarily due to timing of projects at Conda.
FY 2022 Financial Highlights
For FY 2022, the Company’s financial highlights were as follows:
- revenues of $593.3 million in FY 2022 compared to $413.2 million in FY 2021;
- adjusted EBITDA of $224.8 million in FY 2022 compared to $143.4 million in FY 2021;
- net income of $114.7 million in FY 2022 compared to $51.4 million in FY 2021;
- basic earnings of C$0.79/share in FY 2022 compared to C$0.35/share in FY 2021; and
- free cash flow of $187.9 million in FY 2022 compared to $71.3 million in FY 2021.
The increase in the Company’s FY 2022 financial performance compared to FY 2021 was primarily due to higher realized prices and sales volumes at Conda, which were partially offset by higher input costs.
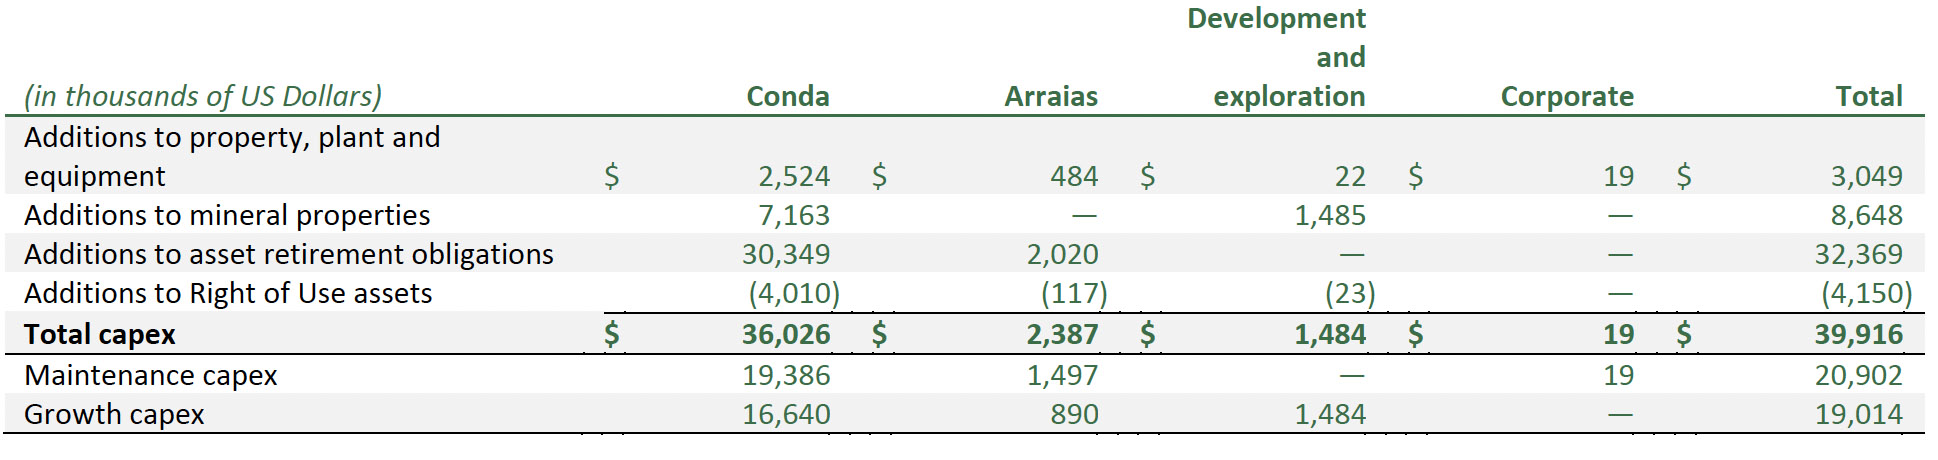
The Company’s total capex spend in FY 2022 was $39.9 million compared to $34.8 million in FY 2021 with the increase primarily due to activities related to the initiative to produce and sell HFSA at Conda and maintenance activities at Arraias related to the restart of the sulfuric acid plant, which were partially offset by a shorter turnaround at Conda in 2022 compared to 2021.
2 Total capex is a non-IFRS financial measure. For additional information on non-IFRS and other financial measures, see “Non-IFRS financial measures” below.
Final Environmental Impact Statement for Conda Mine Life Extension
On November 18, 2022, the Company announced the publication of the Final Environmental Impact Statement (“Final EIS”) for the Husky 1/North Dry Ridge (“H1/NDR”) mine development project. This represents a significant milestone in the extension of Conda’s mine life. The Company will continue to work through the remaining regulatory approval process and expect to begin capital work on the mine extension in the middle part of the year.
Strategic Alternative Review Process
On March 13, 2023, the Company announced the commencement of the process to explore and evaluate various strategic alternatives in an effort to enhance shareholder value.
Anthony Cina, Chairman of Itafos, commented: “Itafos continues to successfully execute on its long-term plan. Over the last year, Itafos has taken decisive actions to strengthen the operational efficiency of the Company, including working to extend the life of the Conda mine, extending the maturity and reducing the cost of the Company’s debt, improving its capital structure through significant deleveraging and strengthening the Company’s management and Board. We expect significant shareholder benefits from these initiatives and believe now is an opportune time to consider the full range of potential strategic alternatives to enhance value for all Itafos shareholders.”
CL Fertilizers Holding LLC, an entity owned by funds managed by Castlelake L.P. and the Company’s largest shareholder, supports the Company’s process to review strategic alternatives.
December 31, 2022 Highlights
As at December 31, 2022, the Company had trailing 12 -month adjusted EBITDA of $224.8 million compared to $143.4 million at the end of 2021 with the increase primarily due to higher realized prices and increased sales volumes at Conda partially offset by higher input costs.
Also, as at December 31, 2022, the Company had net debt of $88.3 million compared to $217.7 million at the end of 2021, with the reduction due to the repayment of principal debt outstanding and higher cash and cash equivalents from free cash flows generated during 2022. The Company also closed during FY 2022, a term loan and asset-based revolving credit facility, which proceeds were used to refinance the 2021 secured term loan, the Company’s unsecured and subordinated promissory note, Conda’s secured working capital facility and the Canadian debentures. The Company’s net debt as at December 31, 2022, was comprised of $42.8 million in cash and $131.1 million in debt (gross of deferred financing costs). As at December 31, 2022, the Company’s net leverage ratio was 0.4x compared to 1.5x at the end of 2021.
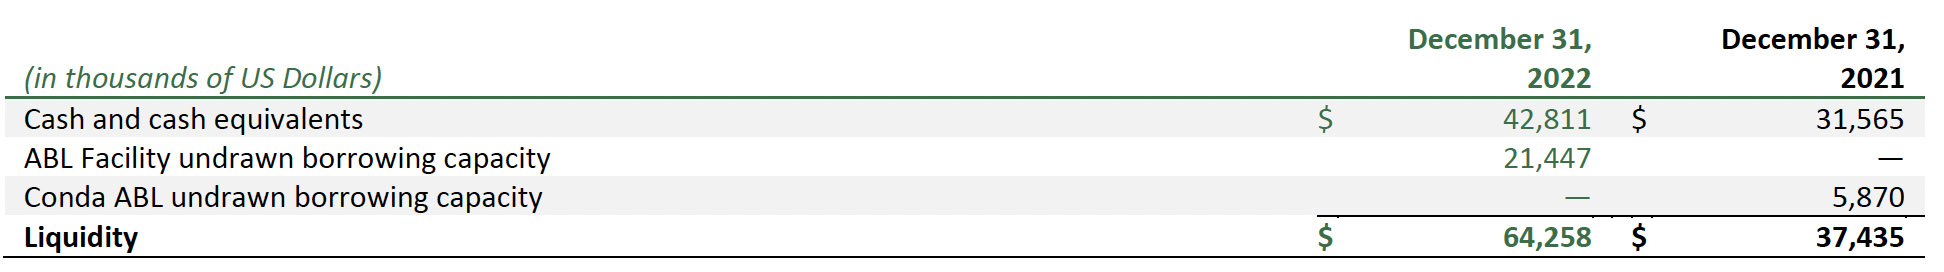
As at December 31, 2022, the Company had liquidity(3) of $64.3 million comprised of $42.8 million in cash and $21.5 million undrawn borrowing capacity under the ABL Facility.
Q4 2022 Operational Highlights
Environmental, Health and Safety (“EHS”)
- sustained EHS excellence, including no reportable environmental releases and one recordable incident; and
- continued corporate-wide risk mitigation measures to address potential impacts to employees, contractors and operations as a result of the COVID-19 pandemic, which resulted in no material impact to operations.
Conda
- produced 89,226 tonnes P2O5 at Conda in Q4 2022 compared to 84,808 tonnes P2O5 in Q4 2021 with the increase primarily due to 2021 disruption in sulfuric acid supply;
- generated revenues of $129.3 million at Conda in Q4 2022 compared to $116.8 million in Q4 2021 with the increase primarily due to higher realized MAP prices (priced on a three-month lag under the terms of the MAP offtake agreement) and increased sales volumes, which were partially offset by lower realized SPA prices;
- generated adjusted EBITDA at Conda of $54.8 million in Q4 2022 compared to $52.8 million in Q4 2021 with the increase primarily due to the same factors that resulted in higher revenues, which were partially offset by higher input costs;
- advanced activities related to the extension of Conda’s mine life through permitting and development of H1/NDR, including a significant milestone on Conda’s mine life extension with the publication of the Final EIS for H1/NDR on November 18, 2022.
3 Liquidity is a non-IFRS financial measure. For additional information on non-IFRS and other financial measures, see “Non-IFRS financial measures” below.
FY 2022 Operational Highlights
EHS
- sustained EHS excellence, including no reportable environmental releases and one recordable incident, which resulted in a consolidated total recordable incident frequency rate of 0.24, representing a new Company record;
- received national recognition during the 87th North American Wildlife and Natural Resources Conference as the Bureau of Land Management awarded the Conservation Leadership Partner Award to the Southeast Idaho Habitat Mitigation Fund, which was developed and funded by Conda;
- continued corporate-wide risk mitigation measures to address potential impacts to employees, contractors and operations as a result of the COVID-19 pandemic, which resulted in no material impact to operations; and
- received a notice of violation (“NOV”) at Conda from the Idaho Department of Environmental Quality (“DEQ”) related to a failed air stack emissions test in May 2021. Conda investigated and corrected the issues during 2021. The NOV was formally received from the DEQ in May 2022 and resolved in July 2022.
Conda
- completed a scheduled plant turnaround at Conda and returned to full production capacity;
- produced 343,526 tonnes P2O5 at Conda in FY 2022 compared to 331,219 tonnes P2O5 in FY 2021 with the increase primarily due to a shorter plant turnaround in 2022 compared to 2021;
- generated revenues of $571.1 million at Conda in FY 2022 compared to $413.2 million in FY 2021 primarily due to higher realized prices and sales volumes;
- generated adjusted EBITDA at Conda of $240.2 million in FY 2022 compared to $160.6 million in FY 2021 primarily due to the same factors that resulted in higher revenues, which were partially offset by higher input costs;
- reached a settlement with insurers on a business interruption claim related to the 2020 disruption in sulfuric acid supply to Conda, which resulted in receipt of net insurance proceeds of $8.7 million;
- reached a settlement agreement related to shared environmental and asset retirement obligations at Conda’s Lanes Creek mine;
- advanced activities related to the extension of Conda’s mine life through permitting and development of H1/NDR, including a significant milestone on Conda’s mine life extension with the publication of the Final EIS for H1/NDR on November 18, 2022; and
- advanced activities related to the optimization of Conda’s EBITDA generation, including beginning production and sales of hydrofluorosilicic acid (“HFSA”).
Q4 Other Highlights
- produced 35,895 tonnes of sulfuric acid at Arraias in Q4 2022 compared to zero production in Q4 2021;
- generated adjusted EBITDA at Arraias of $0 in Q4 2022 compared to a loss of $1.1 million in Q4 2021 with the reduced loss due to the restart of the sulfuric acid plant; and
- continued evaluation of strategic alternatives for non-North American assets.
FY 2022 Other Highlights
- produced 99,030 tonnes of sulfuric acid at Arraias in 2022 compared to no production in 2021;
- generated adjusted EBITDA at Arraias of $0 in 2022 compared to a $3.8 million loss in 2021 with the reduced deficit due to the restart of the sulfuric acid plant;
- continued evaluation of strategic alternatives for non-North American assets;
- announced the appointment of Stephen Shapiro and Isaiah Toback to the Company’s Board of Directors (the “Board”). Mr. Toback replaced Rory O’Neill as a nominee to the Board by its principal shareholder, CL Fertilizer Holdings, LLC; and
- on August 11, 2022, announced the appointment of Matthew O’Neill as Chief Financial Officer (“CFO”). Mr. O’Neill succeeded George Burdette who served as CFO since April 2018.
Subsequent Events
- Subsequent to December 31, 2022, the Company approved the grant of up to, in aggregate, 3,507,846 restricted share units (“RSUs”) under its RSU Plan. The grants were made to directors, officers, management, employees, and contractors of the Company.
Market Outlook
The Company expects the current strength in global agriculture and phosphate fertilizer fundamentals to continue, although 2023 prices are expected to moderate off the historically high 2022 prices. Accordingly, the Company expects continued stability in prices and volume fundamentals in the phosphate fertilizer markets.
Specific factors the Company expects to support the continued strength in the global phosphate fertilizer markets through 2023 are as follows:
- no significant phosphate supply capacity additions
- sustained crop price levels
- improved phosphate application following historically high pricing; and
- ongoing phosphate export restrictions from China.
The Company expects the sulfur and sulfuric acid market to remain soft globally through 2023 due to increased refinery activity and reduced demand from phosphate producers and metals consumers.
Financial Outlook
The Company’s guidance for 2023 is as follows:
Business Outlook
The Company continues to focus on the following key objectives to drive long-term value and shareholder returns:
- improving financial and operational performance;
- deleveraging the balance sheet;
- extending Conda’s current mine life through permitting and development of H1/NDR; and
- conducting the strategic alternatives review process (including evaluating potential strategic alternatives for the company as outlined in the news release dated 13 March, 2023).
About Itafos
The Company is a phosphate and specialty fertilizer company. The Company’s businesses and projects are as follows:
- Conda – a vertically integrated phosphate fertilizer business located in Idaho, US with production capacity as follows:
- approximately 550kt per year of monoammonium phosphate (“MAP”), MAP with micronutrients (“MAP+”), superphosphoric acid (“SPA”), merchant grade phosphoric acid (“MGA”) and ammonium polyphosphate (“APP”); and
- approximately 27kt per year of hydrofluorosilicic acid (“HFSA”);
- Arraias – a vertically integrated phosphate fertilizer business located in Tocantins, Brazil with production capacity as follows:
- approximately 500kt per year of single superphosphate (“SSP”) and SSP with micronutrients (“SSP+”); and
- approximately 40kt per year of excess sulfuric acid (220kt per year gross sulfuric acid production capacity);
- Farim – a high-grade phosphate mine project located in Farim, Guinea-Bissau;
- Santana – a vertically integrated high-grade phosphate mine and fertilizer plant project located in Pará, Brazil; and
- Araxá – a vertically integrated rare earth elements and niobium mine and extraction plant project located in Minas Gerais, Brazil.
In addition to the businesses and projects described above, the Company also owns Mantaro (Junin, Peru), a phosphate mine project that is in the process of being wound down.
The Company is a Delaware corporation that is headquartered in Houston, TX. The Company’s shares trade on the TSX Venture Exchange (“TSX-V”) under the ticker symbol “IFOS”. The Company’s principal shareholder is CL Fertilizers Holding LLC (“CLF”). CLF is an affiliate of Castlelake, L.P., a global private investment firm.
For more information, or to join the Company’s mailing list to receive notification of future news releases, please visit the Company’s website at www.itafos.com.
Forward-Looking Information
Certain information contained in this news release constitutes forward-looking information, including statements with respect to: the exploration and evaluation of strategic alternatives; the timing for the extension of the life of the Conda mine; and the continued strength in the global phosphate fertilizer markets. All information other than information of historical fact is forward-looking information. Statements that address activities, events or developments that the Company believes, expects or anticipates will or may occur in the future include, but are not limited to, statements regarding estimates and/or assumptions in respect of the Company’s financial and business outlook are forward-looking information. The use of any of the words “intend”, “anticipate”, “plan”, “continue”, “estimate”, “expect”, “may”, “will”, “project”, “should”, “would”, “believe”, “predict” and “potential” and similar expressions are intended to identify forward-looking information. This information involves known and unknown risks, uncertainties and other factors that may cause actual results or events to differ materially from those anticipated in such forward-looking information. No assurance can be given that this information will prove to be correct and such forward-looking information included in this news release should not be unduly relied upon.
Forward-looking information is subject to a number of risks and other factors that could cause actual results and events to vary materially from that anticipated by such forward-looking information. Although the Company has attempted to identify important factors that could cause actual results to differ materially from those contained in forward-looking statements, there may be other factors that cause results not to be as anticipated, estimated or intended. Factors that may cause actual results to differ materially from expected results described in forward-looking statements include, but are not limited to, uncertainties of estimates of capital and operating costs and production estimates; the ability of the Company to meet its financial obligations and minimum commitments, fund capital expenditures and comply with covenants contained in the agreements that govern indebtedness; fluctuations in foreign exchange or interest rates and stock market volatility; the continued supply of sulfuric acid to Conda from its primary supplier; the risk that the strategic alternatives review process will not result in the Company pursuing any transaction or that any alternative will be available to the Company; and those risk factors set out in the Company’s annual information form and other disclosure documents available under the Company’s profile on SEDAR at www.sedar.com and on the Company’s website at www.itafos.com. Readers are cautioned that the foregoing list of risks, uncertainties and assumptions are not exhaustive. The forward-looking information included in this news release is expressly qualified by this cautionary statement and is made as of the date of this news release. The Company undertakes no obligation to publicly update or revise any forward-looking information except as required by applicable securities laws.
This news release contains future oriented financial information and financial outlook information (together, “FOFI”) about the Company’s prospective results of operations, including statements regarding expected adjusted EBITDA, net income, basic earnings per share, maintenance capex, growth capex and free cash flow. FOFI is subject to the same assumptions, risk factors, limitations and qualifications as set forth in the above paragraph. The Company has included the FOFI to provide an outlook of management’s expectations regarding anticipated activities and results, and such information may not be appropriate for other purposes. The Company and management believe that the FOFI has been prepared on a reasonable basis, reflecting management’s reasonable estimates and judgements; however, actual results of operations and the resulting financial results may vary from the amounts set forth herein. Any financial outlook information speaks only as of the date on which it is made and the Company undertakes no obligation to publicly update or revise any financial outlook information except as required by applicable securities laws.
NEITHER THE TSX-V NOR ITS REGULATION SERVICES PROVIDER (AS THAT TERM IS DEFINED IN THE POLICIES OF THE TSX-V) ACCEPTS RESPONSIBILITY FOR THE ADEQUACY OR ACCURACY OF THIS NEWS RELEASE.
For further information, please contact:
Matthew O’Neill
Itafos Investor Relations
investor@itafos.com
713-242-8446
Non-IFRS Financial Measures
This press release contains both IFRS and certain non-IFRS measures that management considers to evaluate the Company’s operational and financial performance. Non-IFRS measures are a numerical measure of a company’s performance, that either include or exclude amounts that are not normally included or excluded from the most directly comparable IFRS measures. Management believes that the non-IFRS measures provide useful supplemental information to investors, analysts, lenders and others. In evaluating non-IFRS measures, investors, analysts, lenders and others should consider that non-IFRS measures do not have any standardized meaning under IFRS and that the methodology applied by the Company in calculating such non-IFRS measures may differ among companies and analysts. Non-IFRS measures should not be considered as a substitute for, nor superior to, measures of financial performance prepared in accordance with IFRS. Definitions and reconciliations of non-IFRS measures to the most directly comparable IFRS measures are included below.
DEFINITIONS
The Company defines its non-IFRS measures as follows:
Non-IFRS Measure | Definition | Most Directly Comparable IFRS Measure |
EBITDA | Earnings before interest, taxes, depreciation, depletion and amortization | Net income (loss) and operating income (loss) |
Adjusted EBITDA | EBITDA adjusted for non-cash, extraordinary, non-recurring and other items unrelated to the Company’s core operating activities | Net income (loss) and operating income (loss) |
Trailing 12 months adjusted EBITDA | Adjusted EBITDA for the current and preceding three quarters | Net income (loss) and operating income (loss) for the current and preceding three quarters |
Total capex | Additions to property, plant, and equipment and mineral properties adjusted for additions to asset retirement obligations, additions to right-of-use assets and capitalized interest | Additions to property, plant and equipment and mineral properties |
Maintenance capex | Portion of total capex relating to the maintenance of ongoing operations | Additions to property, plant and equipment and mineral properties |
Growth capex | Portion of total capex relating to the development of growth opportunities | Additions to property, plant and equipment and mineral properties |
Cash growth capex | Growth capex less accrued growth capex | Additions to property, plant and equipment and mineral properties |
Net debt | Debt less cash and cash equivalents plus deferred financing costs (does not consider lease liabilities) | Current debt, long-term debt and cash and cash equivalents |
Net leverage ratio | Net debt divided by trailing 12 months adjusted EBITDA | Current debt, long-term debt and cash and cash equivalents; net income (loss) and operating income (loss) for the current and preceding three quarters |
Liquidity | Cash and cash equivalents plus undrawn committed borrowing capacity | Cash and cash equivalents |
Free cash flow | Cash flows from operating activities, which excludes payment of interest expense, plus cash flows from investing activities less cash growth capex | Cash flows from operating activities and cash flows from investing activities |
EBITDA, ADJUSTED EBITDA AND TRAILING 12 MONTHS ADJUSTED EBITDA
EBITDA is a non-IFRS measure that excludes interest, taxes, depreciation, depletion and amortization from earnings. Management believes that EBITDA is a valuable indicator of the Company’s ability to generate operating income.
Adjusted EBITDA is a non-IFRS measure that excludes non-cash, extraordinary, non-recurring and other items unrelated to the Company’s core operating activities from EBITDA (non-IFRS measure). Management believes that adjusted EBITDA is a valuable indicator of the Company’s ability to generate operating income from its core operating activities normalized to remove the impact of non-cash, extraordinary and non-recurring items. The Company provides guidance on adjusted EBITDA as useful supplemental information to investors, analysts, lenders and others.
Trailing 12 months adjusted EBITDA is a non-IFRS measure that includes adjusted EBITDA (non-IFRS measure) for the current and preceding three quarters.
For the three months ended December 31, 2022 and 2021
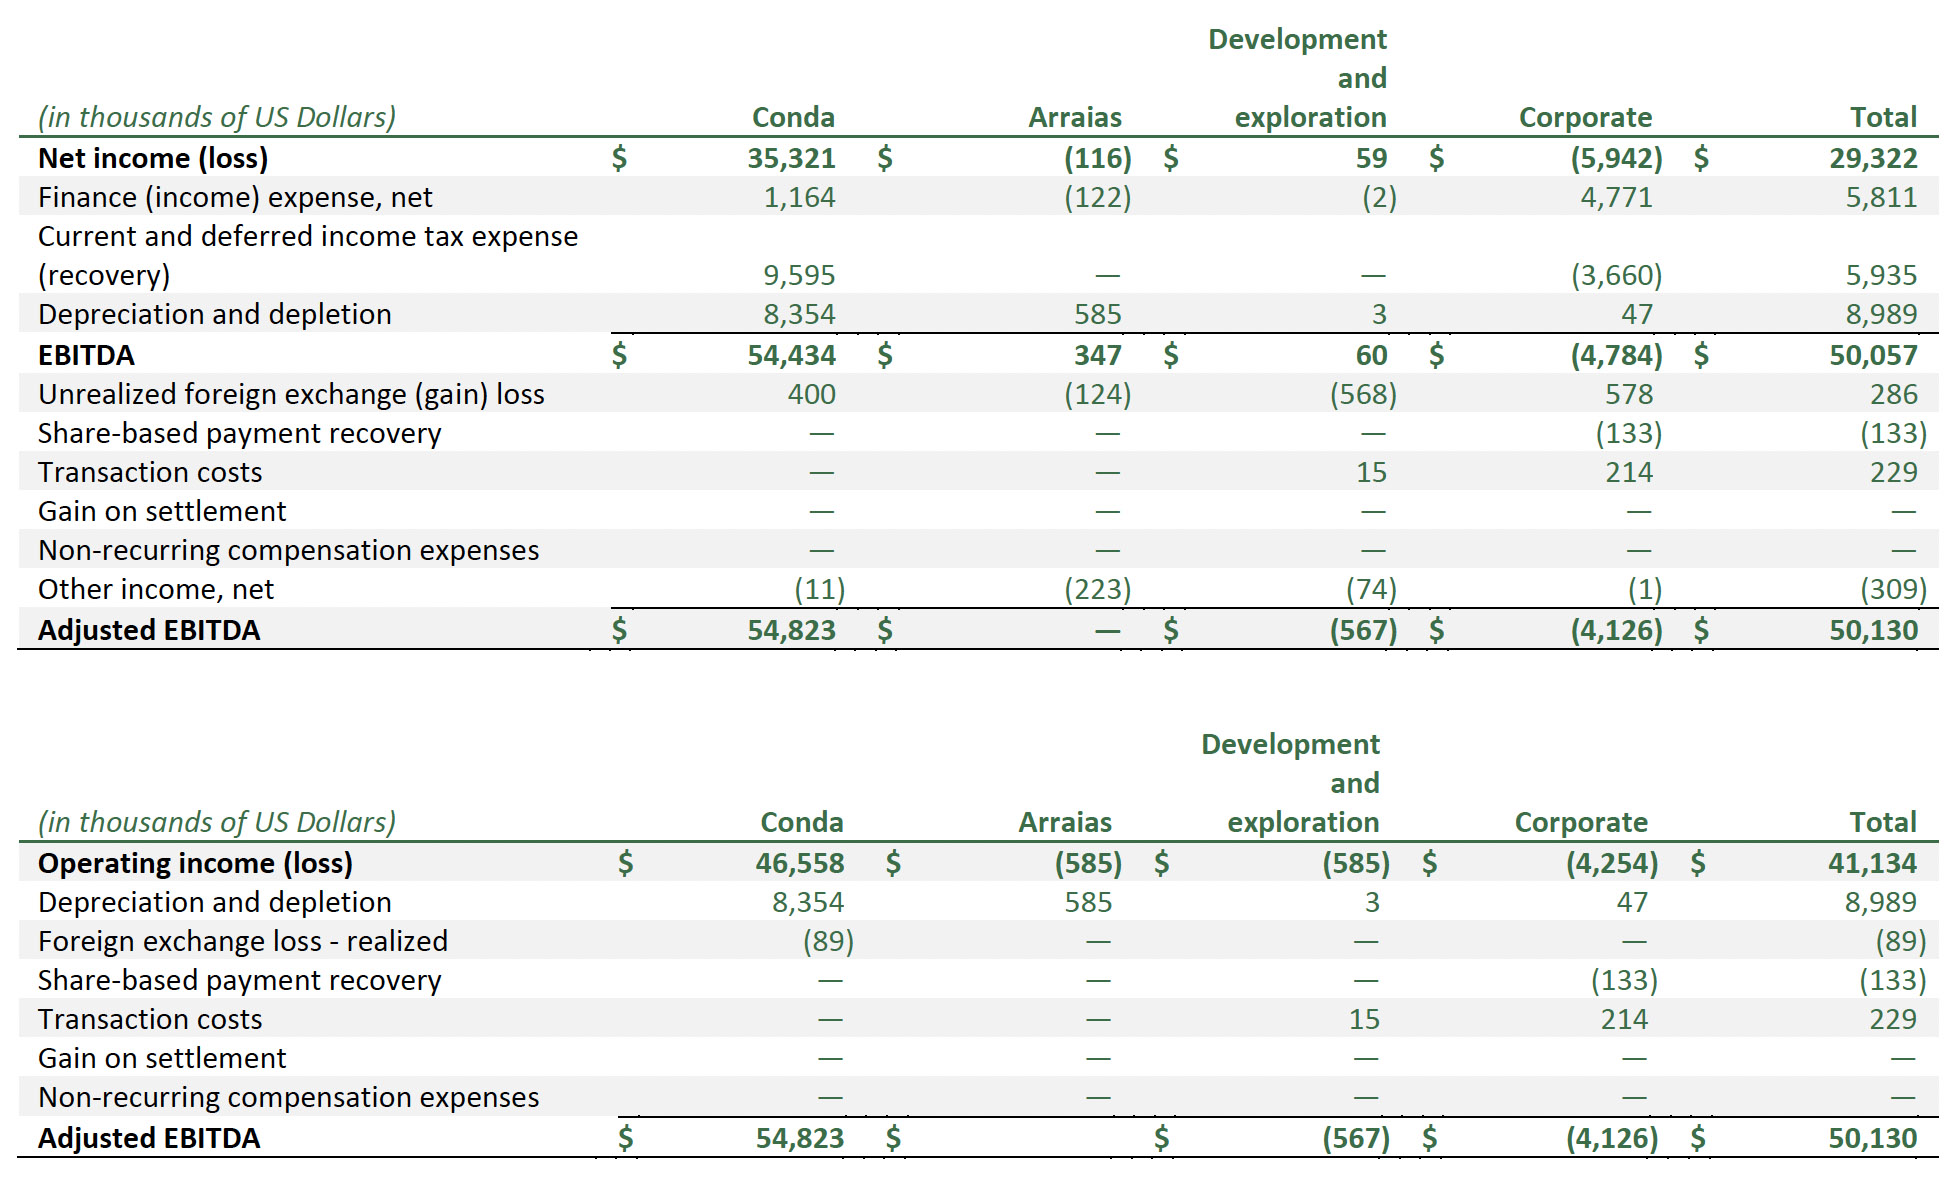
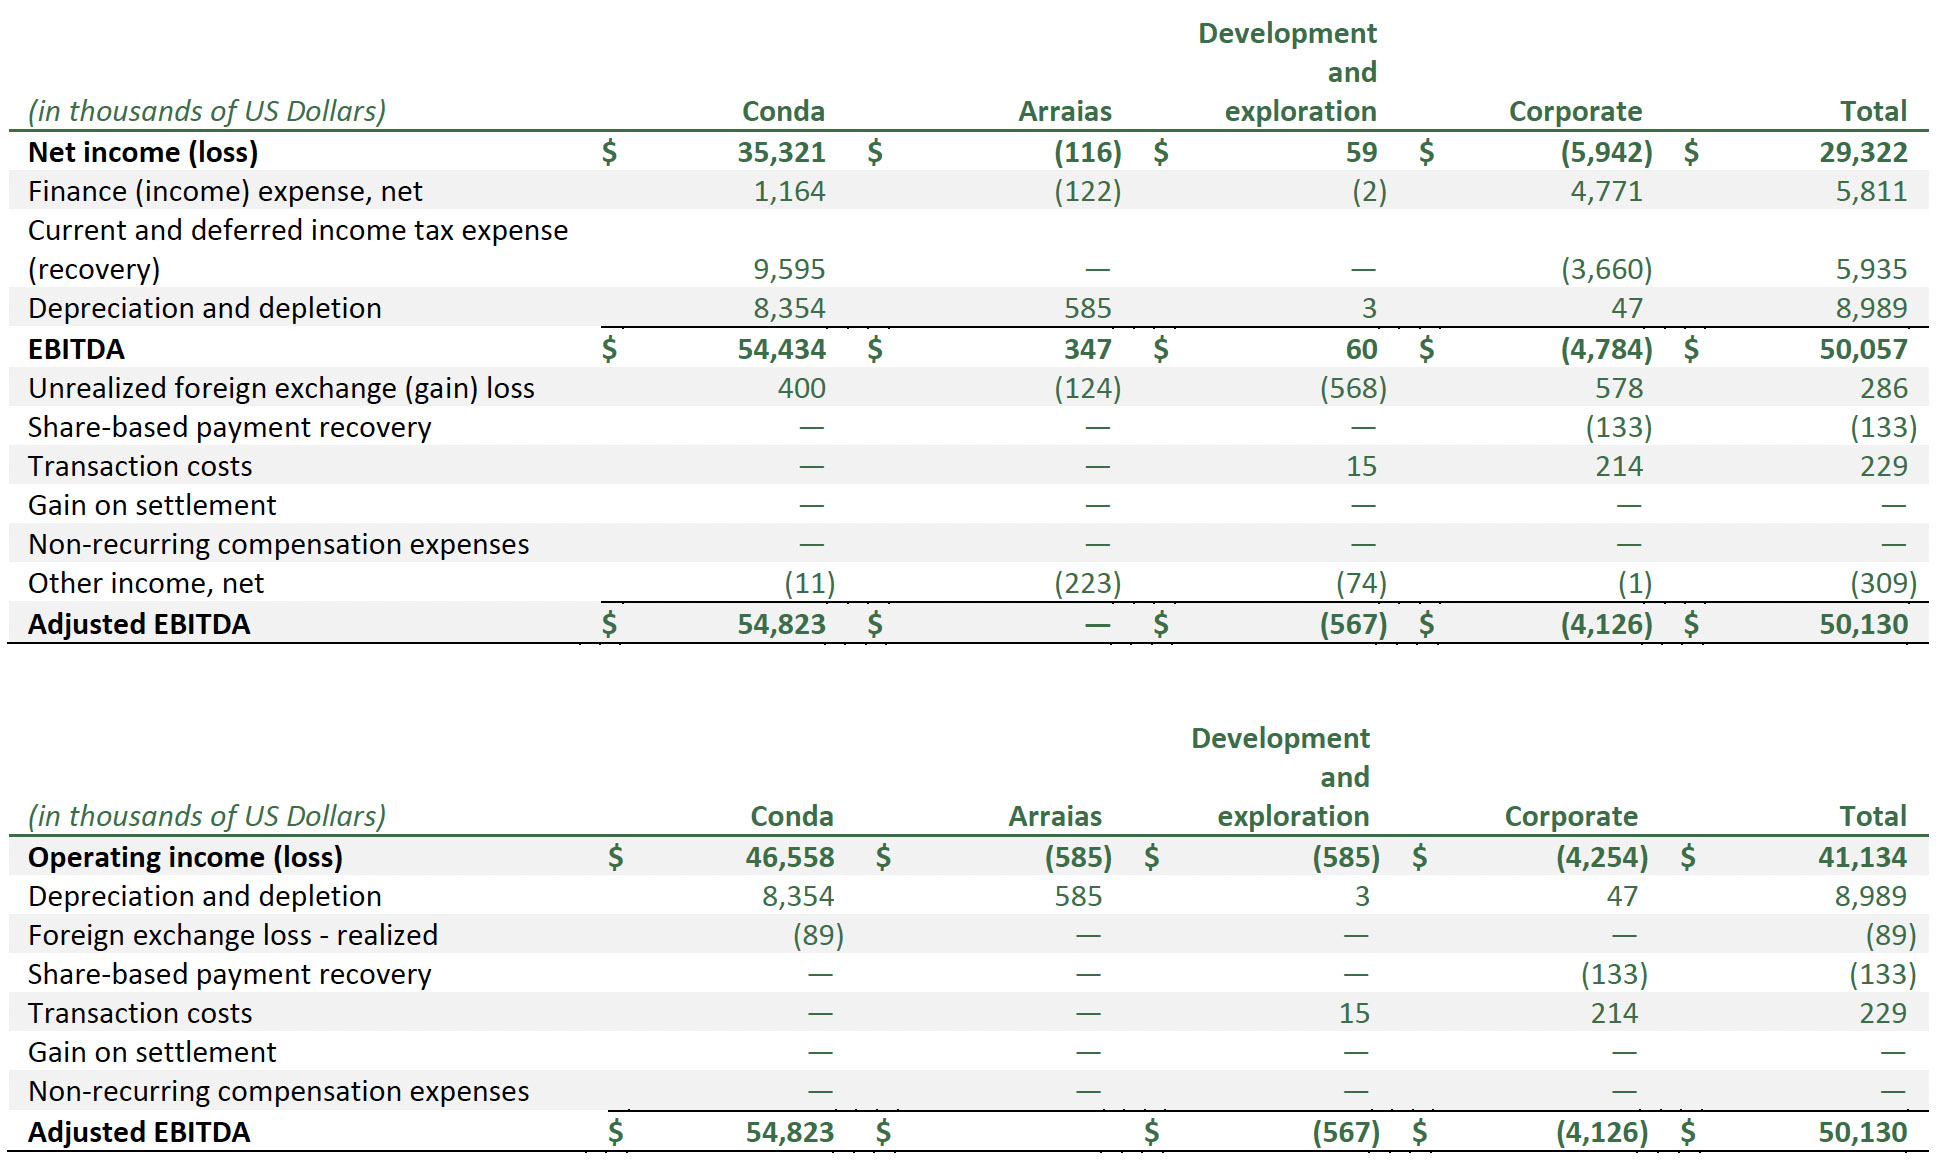
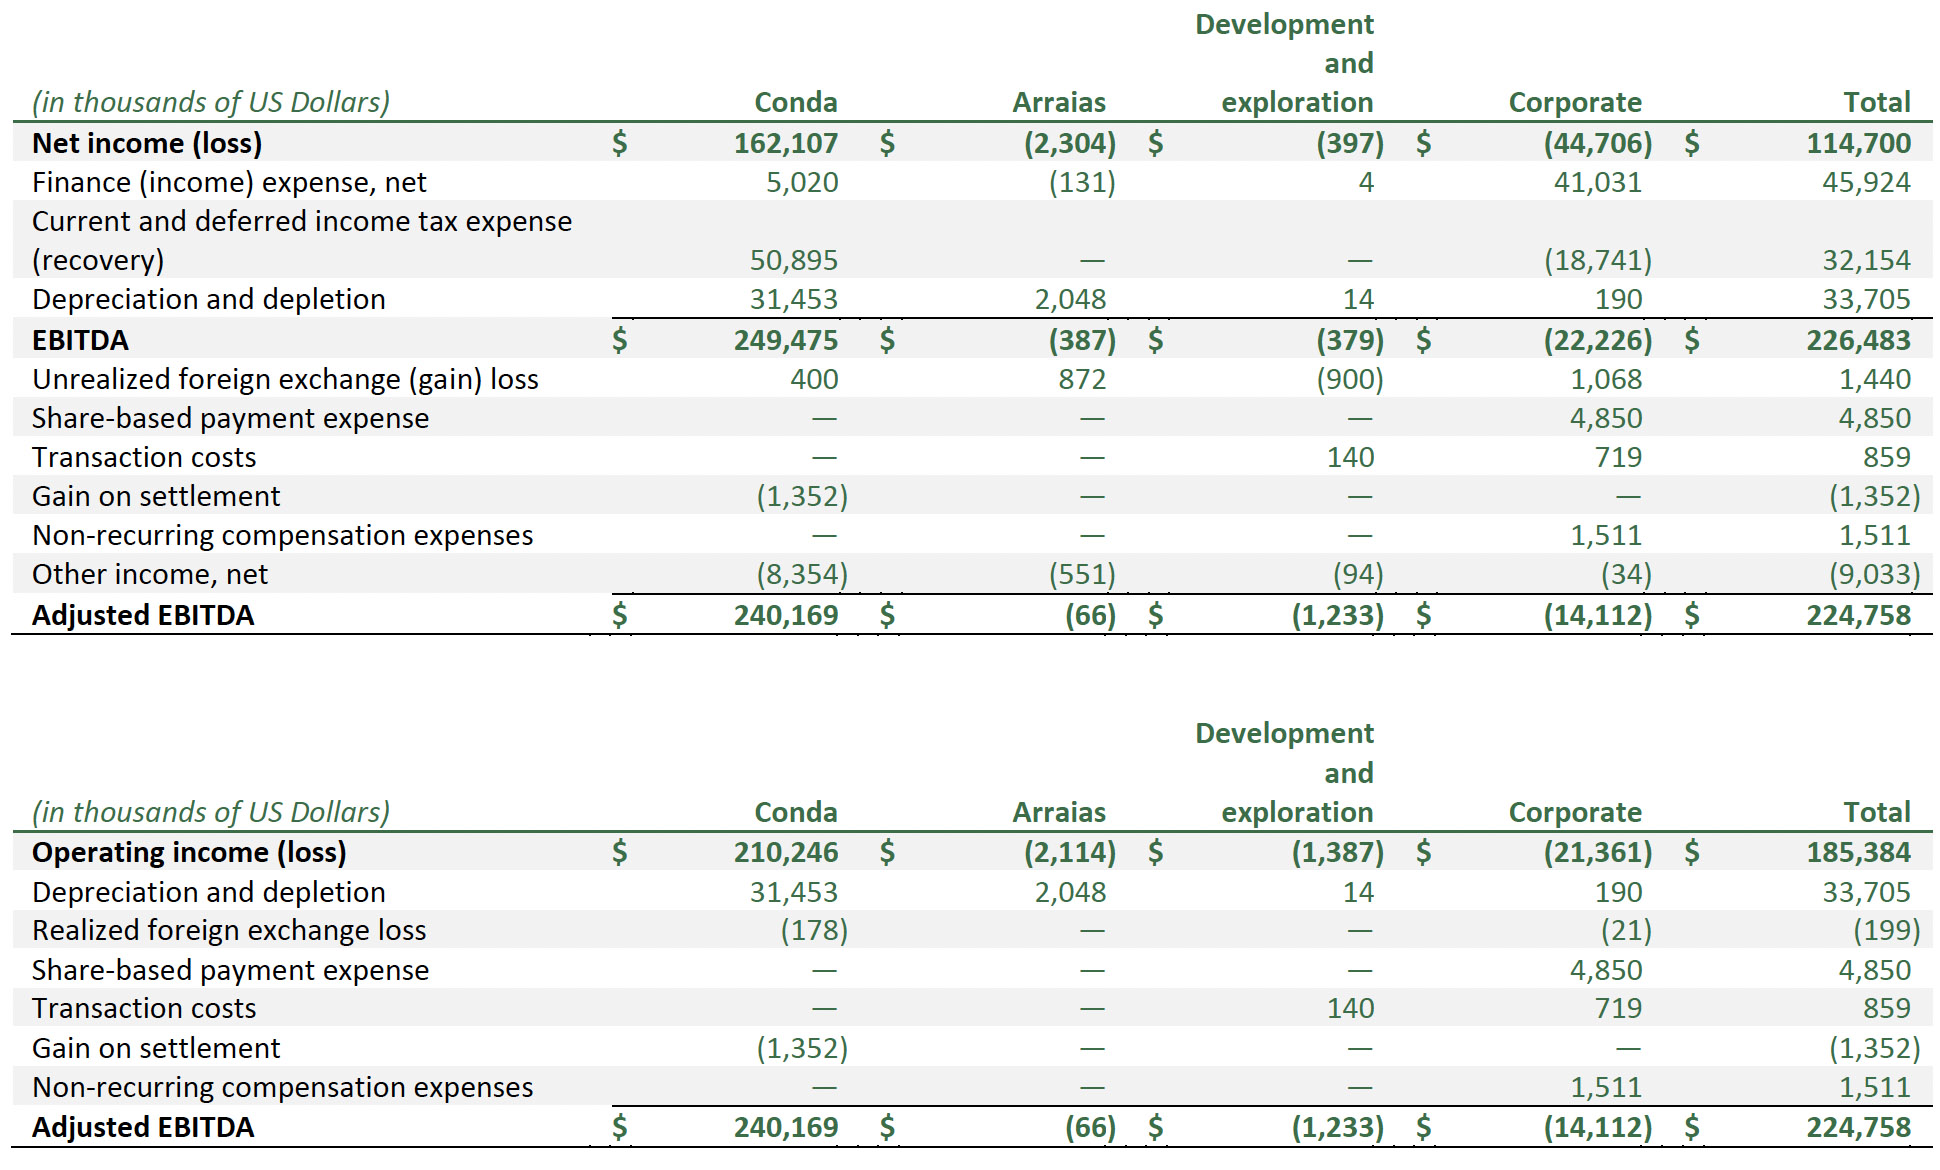
For the three months ended December 31, 2022, the Company had EBITDA and adjusted EBITDA by segment as follows:
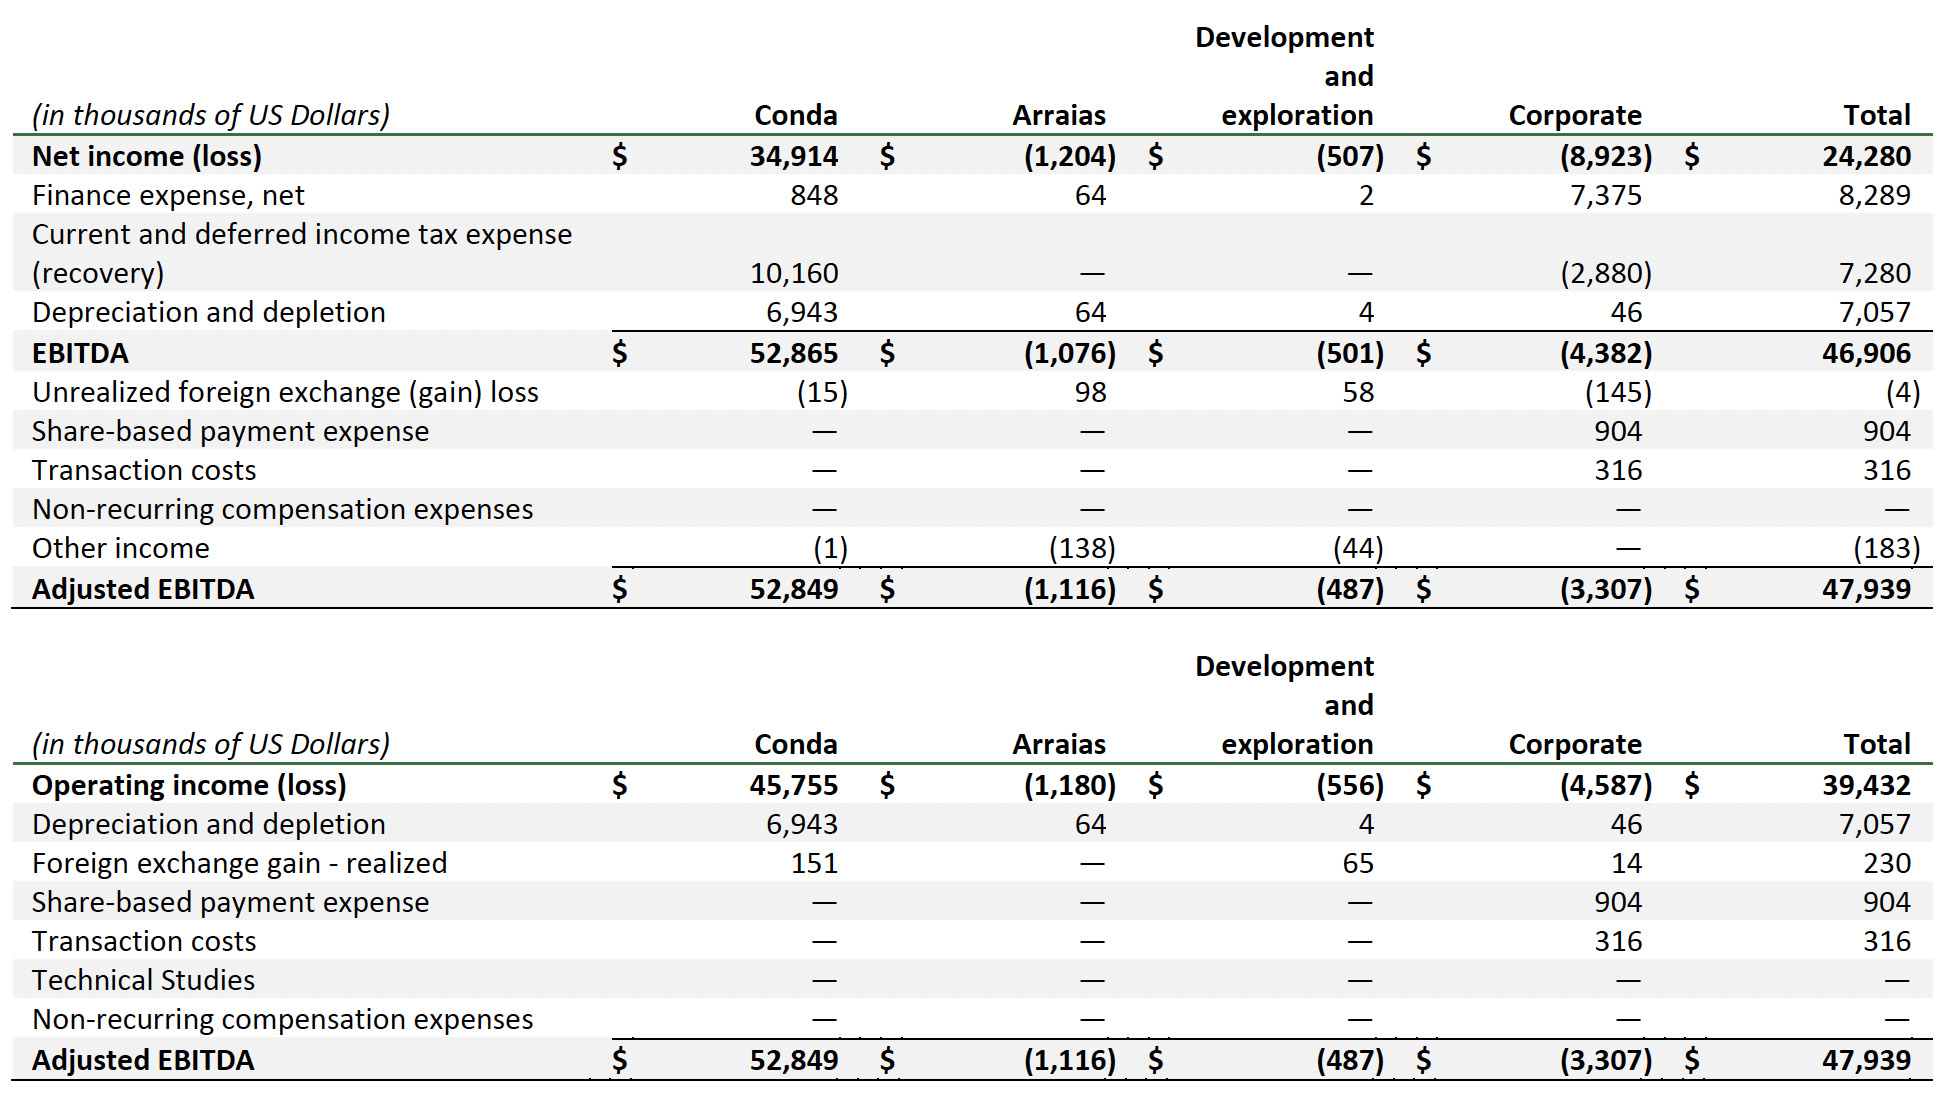
For the three months ended December 31 2021, the Company had EBITDA and adjusted EBITDA by segment as follows:
For the year ended December 31, 2022 and 2021
For the year ended December 31, 2022, the Company had EBITDA and adjusted EBITDA by segment as follows:
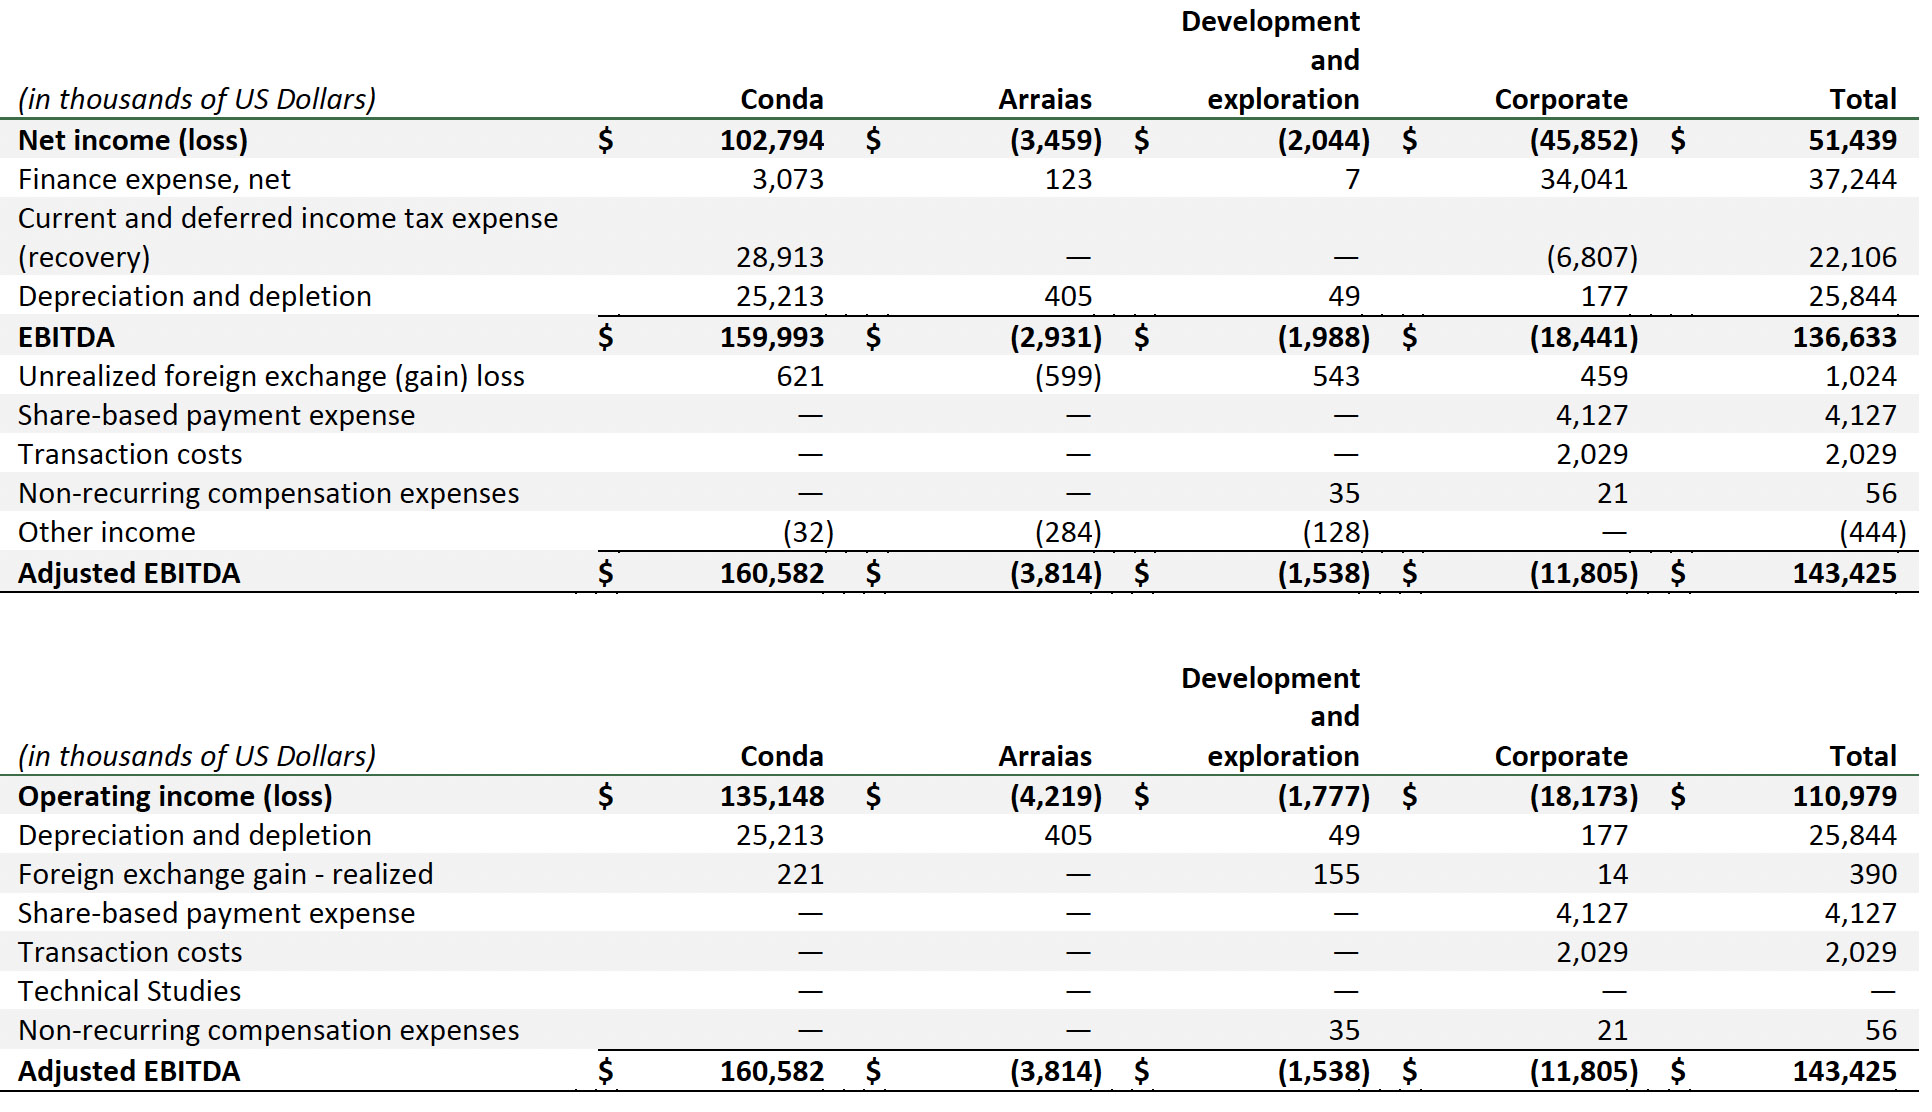
For the year ended December 31, 2021, the Company had EBITDA and adjusted EBITDA by segment as follows:
As at December 31, 2022 and December 31, 2021
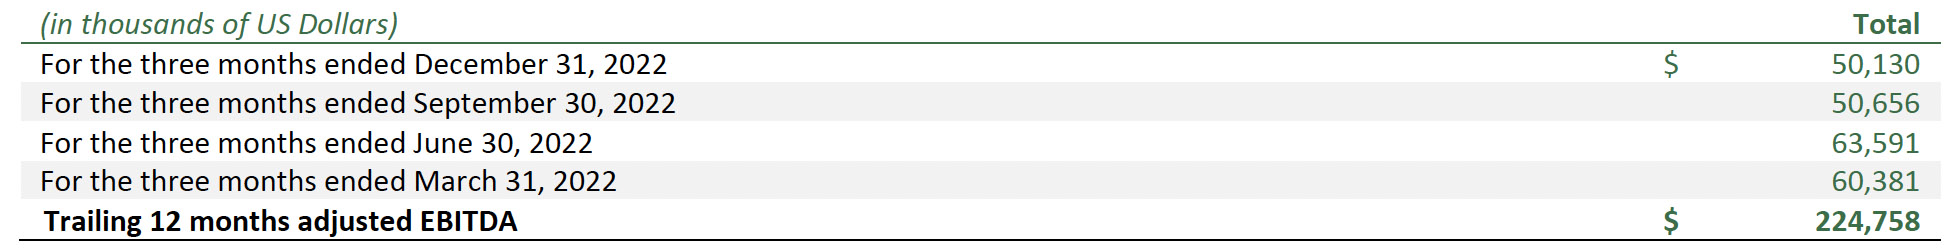
As at December 31, 2022, the Company had trailing 12 months adjusted EBITDA as follows:
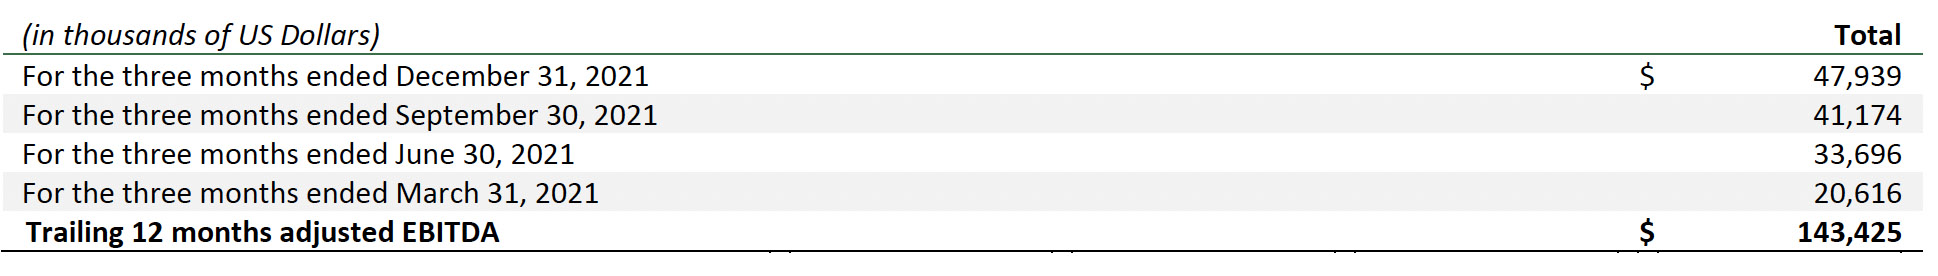
As at December 31, 2021, the Company had trailing 12 months adjusted EBITDA as follows:
TOTAL CAPEX
Total capex is a non-IFRS measure that includes additions to property, plant, and equipment and mineral properties, which are adjusted for additions to asset retirement obligations, additions to right-of-use assets and capitalized interest.
Maintenance capex is a non-IFRS measure that includes the portion of total capex (non-IFRS measure) relating to the maintenance of ongoing operations. Management believes that maintenance capex is a valuable indicator of the Company’s required capital expenditures to sustain operations at existing levels.
Growth capex is a non-IFRS measure that includes the portion of total capex (non-IFRS measure) relating to the development of growth opportunities. Management believe that growth capex is a valuable indicator of the Company’s capital expenditures related to growth opportunities.
The Company provides guidance on both maintenance capex and growth capex as useful supplemental information to investors, analysts, lenders and others.
For the three months ended December 31, 2022 and 2021
For the three months ended December 31, 2022, the Company had capex by segment as follows:
For the three months ended December 31, 2021, the Company had capex by segment as follows:

For the years ended December 31, 2022 and 2021
For the year ended December 31, 2022, the Company had capex by segment as follows:
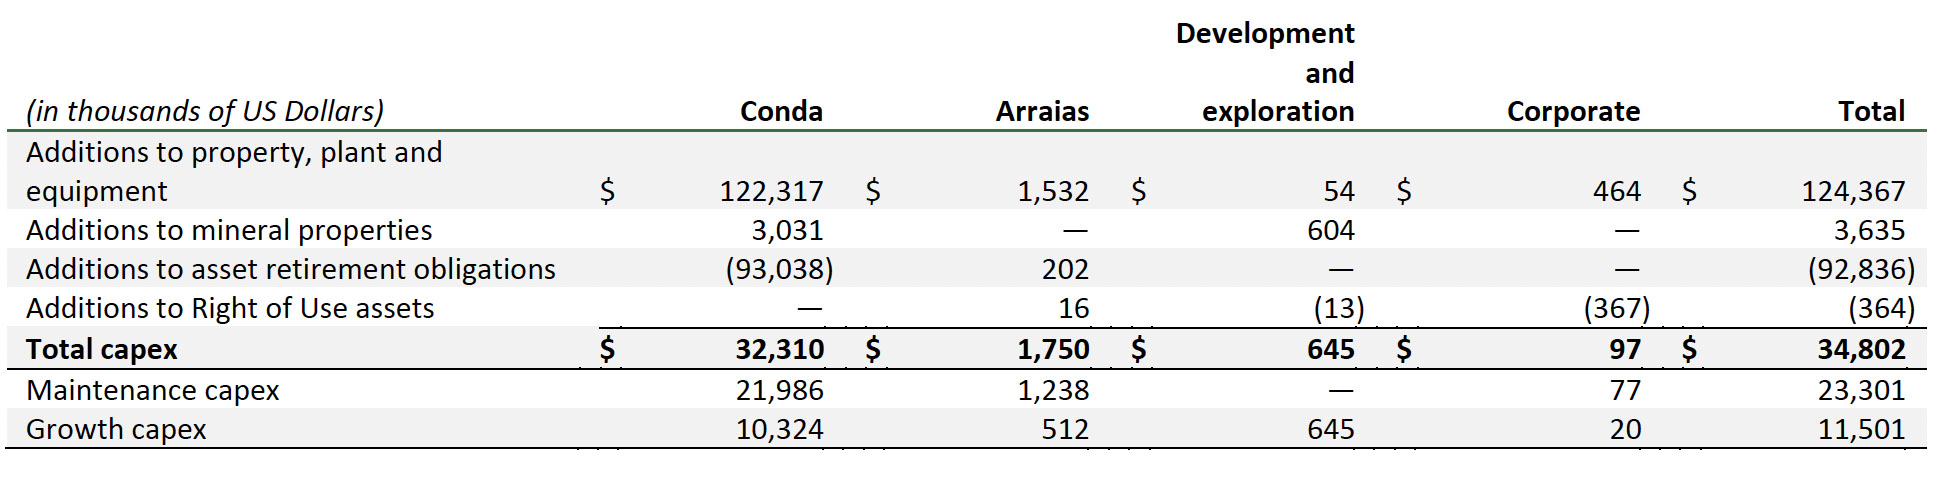
For the year ended December 31, 2021, the Company had capex by segment as follows:
CASH GROWTH CAPEX
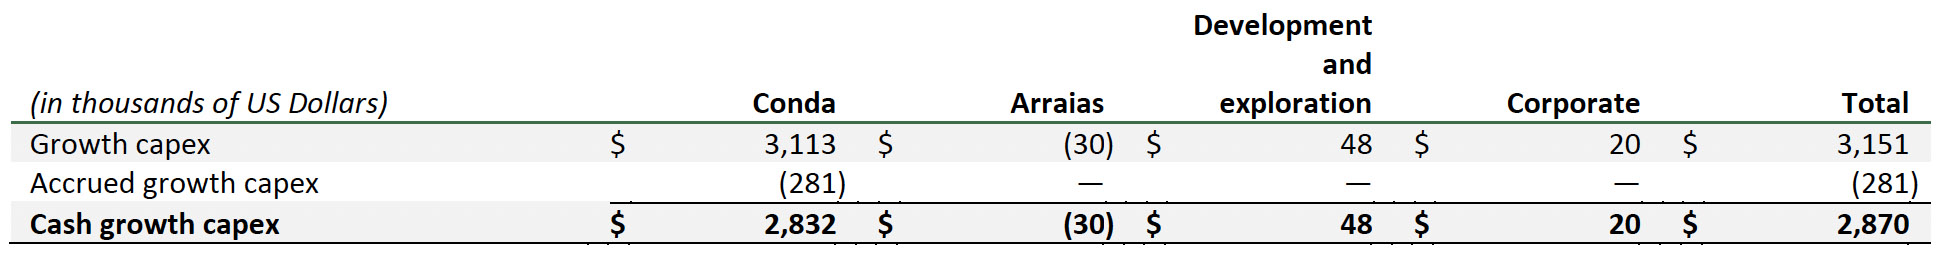
Cash growth capex is a non-IFRS measures that excludes accrued capex from growth capex (non-IFRS measure). The Company uses cash growth capex in the calculation of free cash flow (non-IFRS measure).
For the three months ended December 31, 2022 and 2021
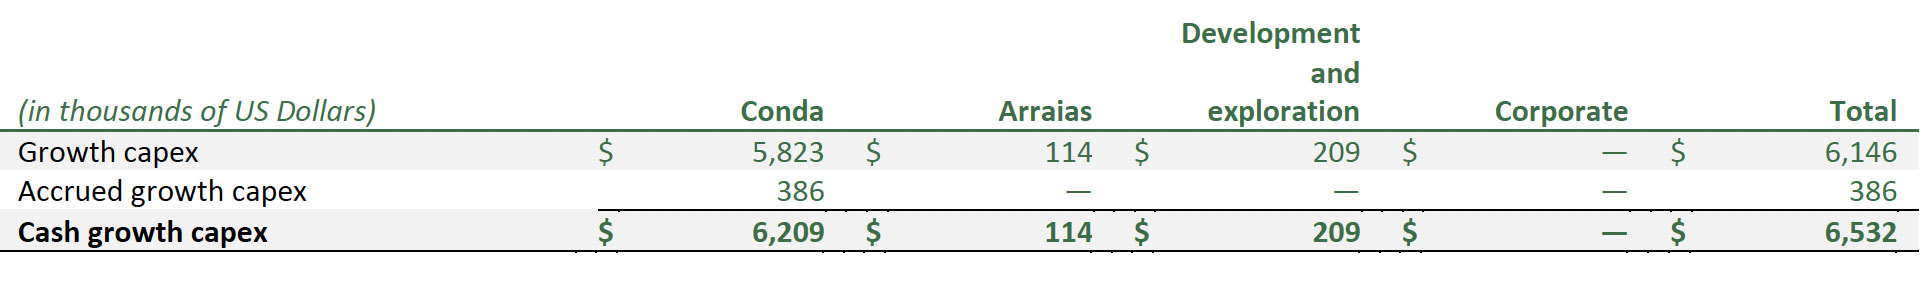
For the three months ended December 31, 2022, the Company had cash growth capex by segment as follows:
For the three months ended December 31, 2021, the Company had cash growth capex by segment as follows:
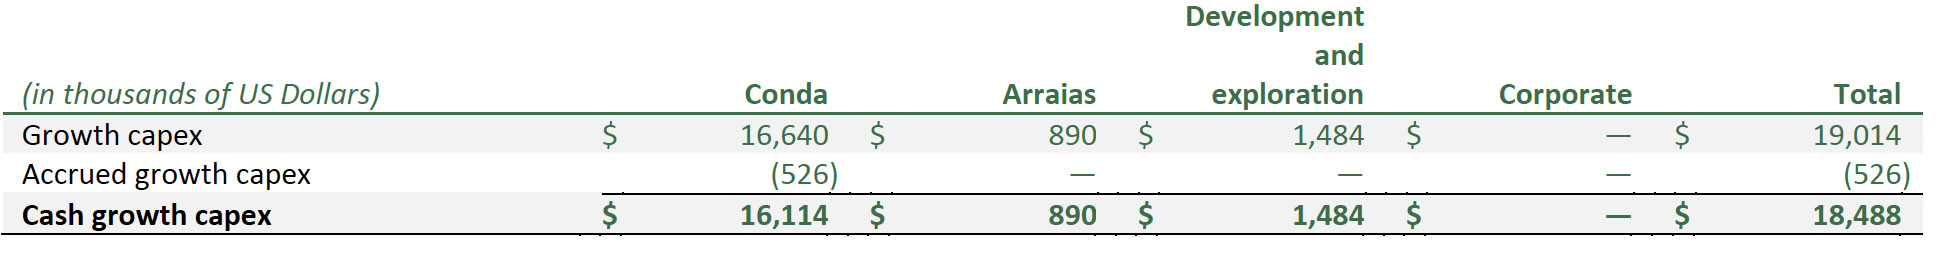
For the years ended December 31, 2022 and 2021
For the year ended December 31, 2022, the Company had cash growth capex by segment as follows:
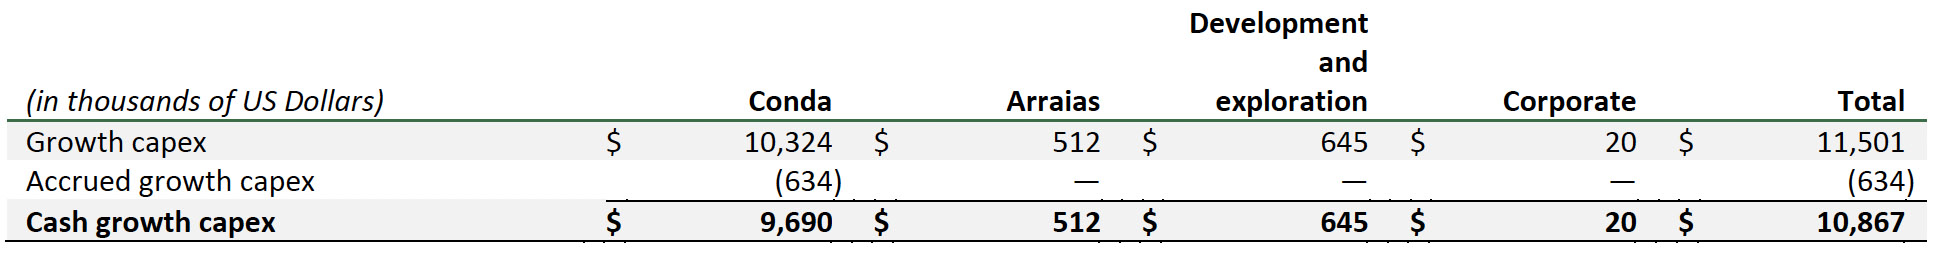
For the year ended December 31, 2021, the Company had cash growth capex by segment as follows:
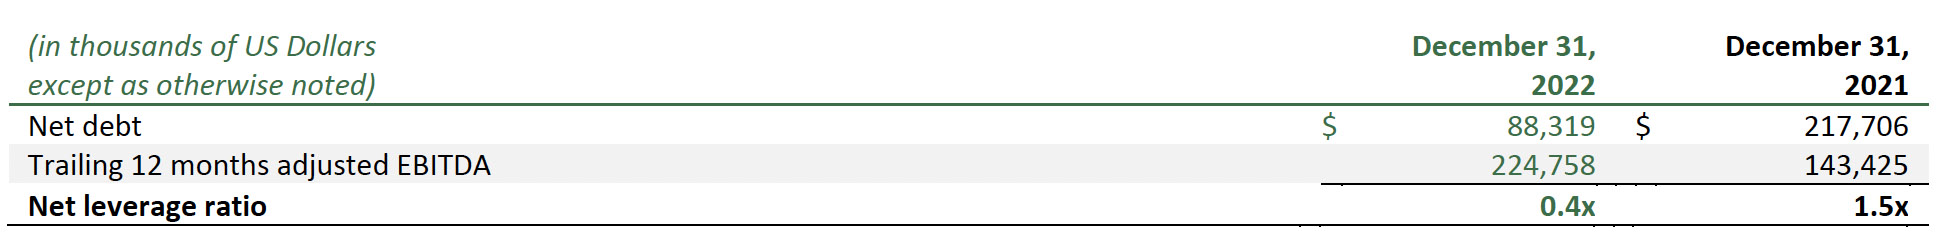
NET DEBT and NET LEVERAGE RATIO
Net debt is a non-IFRS measure that includes debt less cash and cash equivalents and excludes deferred financing costs from debt. The Company’s net debt does not include lease liabilities. Management believes that net debt is a valuable indicator of the Company’s net debt position as it removes the impact of deferring financing costs.
Net leverage ratio is a non-IFRS measure that considers net debt (non-IFRS measure) divided by trailing 12 months adjusted EBITDA (non-IFRS measure). Management believes that the Company’s net leverage ratio is a valuable indicator of its ability to service its debt from its core operating activities.
As at December 31, 2022 and December 31, 2021, the Company had net debt as follows:

As at December 31, 2022 and December 31, 2021, the Company’s net leverage ratio was as follows:
LIQUIDITY
Liquidity is a non-IFRS measure that includes cash and cash equivalents plus undrawn committed borrowing capacity. Management believes that liquidity is a valuable indicator of the Company’s liquidity.
As at December 31, 2022 and December 31, 2021, the Company had liquidity as follows:
FREE CASH FLOW
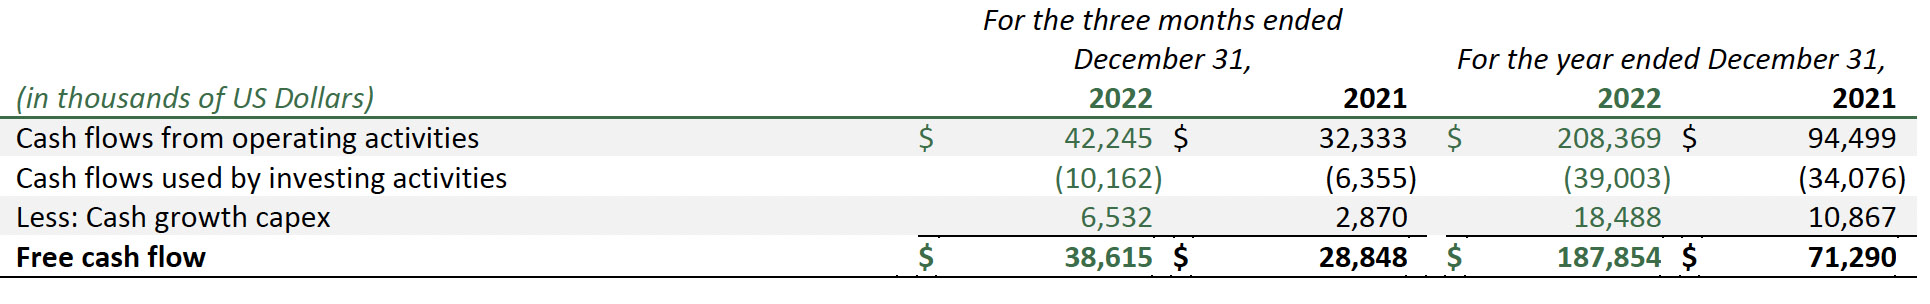
Free cash flow is a non-IFRS measure that includes cash flows from operating activities (which excludes payment of interest expense) and cash flows from investing activities less cash growth capex (non-IFRS measure). Management believes that free cash flow is a valuable indicator of the Company’s ability to generate cash flows from operations after giving effect to required capital expenditures to sustain operations at existing levels. Management further believes that free cash flow is a valuable indicator of the Company’s cash flow available for debt service or to fund growth opportunities. The Company provides guidance on free cash flow as useful supplemental information to investors, analysts, lenders and others.
For the three months and years ended December 31, 2022 and 2021, the Company had free cash flow as follows: