
Q3 2022 Key Highlights
- revenues of $153.2 million
- adjusted EBITDA of $50.7 million(1)
- net income of $8.1 million
- basic earnings of C$0.06/share
- free cash flow of $53.6 million(1)
9M 2022 Key Highlights
- revenues of $458.0 million
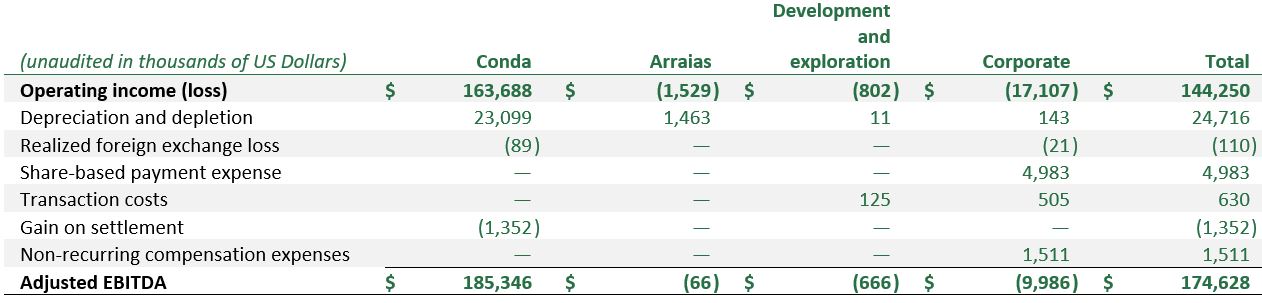
- adjusted EBITDA of $174.6 million
- net income of $85.4 million
- basic earnings of C$0.58/share
- free cash flow of $149.2 million
September 30, 2022 Key Highlights
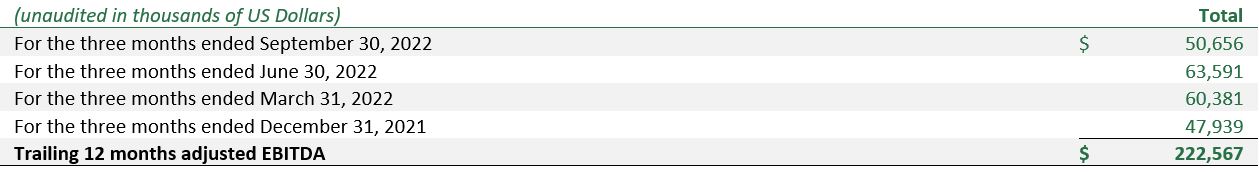
- trailing 12 months adjusted EBITDA of $222.6 million(1)
- net debt of $117.7 million(1)
- net leverage ratio of 0.5x(1)
Maintained FY 2022 Guidance
- adjusted EBITDA guidance of $210-230 million
- net income guidance of $100-105 million
- basic earnings guidance of C$0.69-0.72/share
- maintenance capex guidance of $18-22 million(1)
- growth capex guidance of $18-21 million(1)
- free cash flow guidance of $150-165 million
CEO Commentary
“We are pleased to report continued strong safety, financial and operational performance during the third quarter. Financially we recognized $153.2 million of revenues and $50.7 million of adjusted EBITDA on the back of continued strong production out of our Conda facility while achieving company record safety performance
“On September 22 we completed a major strategic initiative, refinancing our outstanding debt. The new credit facilities entered into, extend our debt maturity and create more flexibility for the funding of the long-term growth of the business. As a result of record financial performance for the nine months ended September 2022, we have made significant progress toward deleveraging our balance sheet. In the first three quarters of 2022, we have reduced net debt by $100MM resulting in a net leverage ratio of 0.5x at the end of the period,” said G. David Delaney, CEO of Itafos.
“We have also reiterated our full-year guidance for 2022 to reflect the continued strength of the business and market fundamentals. Finally, we remain focused on our key objectives, including extending Conda’s current mine life through permitting and development of H1/NDR and evaluating strategic alternatives for our non-North American assets.”
HOUSTON, TX – November 14, 2022 – Itafos Inc. (TSX-V: IFOS) (the “Company”) reported today its Q3 and 9M 2022 financial and operational highlights. The Company’s financial statements and management’s discussion and analysis and annual information form for the three and nine months ended September 30, 2022 are available under the Company’s profile at www.sedar.com and on the Company’s website at www.itafos.com. All figures are in thousands of US Dollars except as otherwise noted.
Q3 and 9M Market Highlights
DAP NOLA prices averaged $761/short ton (“st”) in Q3 2022 compared to $624/st in Q3 2021, up 22% year-over-year driven by strong agriculture and phosphate fertilizer market supply and demand dynamics. Similarly, DAP NOLA prices averaged $805/st in 9M 2022 compared to $568/st in 9M 2021, up 42% year-over-year. Specific factors driving the year-over-year improvements in DAP NOLA were as follows:
Specific factors driving the year-over-year improvements in DAP NOLA were as follows:
- limited phosphate capacity additions
- multi-year low stocks-to-use ratios for global coarse grains and oilseeds supporting fertilizer relative affordability;
- very constructive crop prices in 2022 and transitioning into 2023;
- continued drawdown of inventory levels; and
- continued restrictions and controls on exports of phosphate from China.
Q3 2022 Financial Highlights
For the Q3 2022, the Company’s financial highlights were as follows:
- revenues of $153.2 million in Q3 2022 compared to $103.0 million in Q3 2021;
- adjusted EBITDA of $50.7 million in Q3 2022 compared to $41.2 million in Q3 2021;
- net income of $8.1 million in Q3 2022 compared to $15.7 million in Q3 2021;
- basic earnings of C$0.06/share in Q3 2022 compared to C$0.10/share in Q3 2021; and
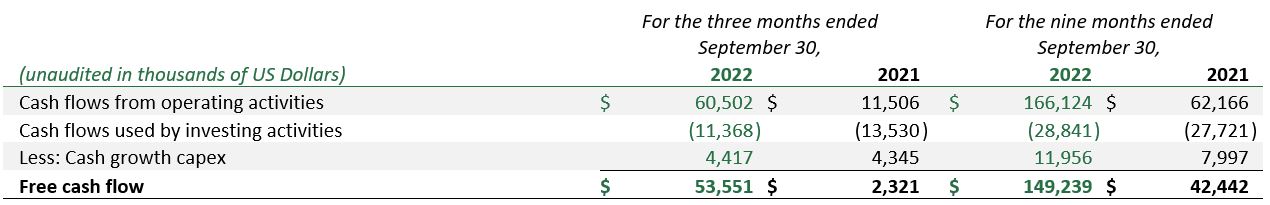
- free cash flow of $53.6 million in Q3 2022 compared to $2.3 million in Q3 2021.
The increase in the Company’s Q3 2022 financial performance compared to Q3 2021 was primarily due to higher realized prices and sales volumes at Conda, which were partially offset by higher input costs, and the restart of the sulfuric acid plant at Arraias. The decrease in net income was primarily due to higher finance and income tax expenses.
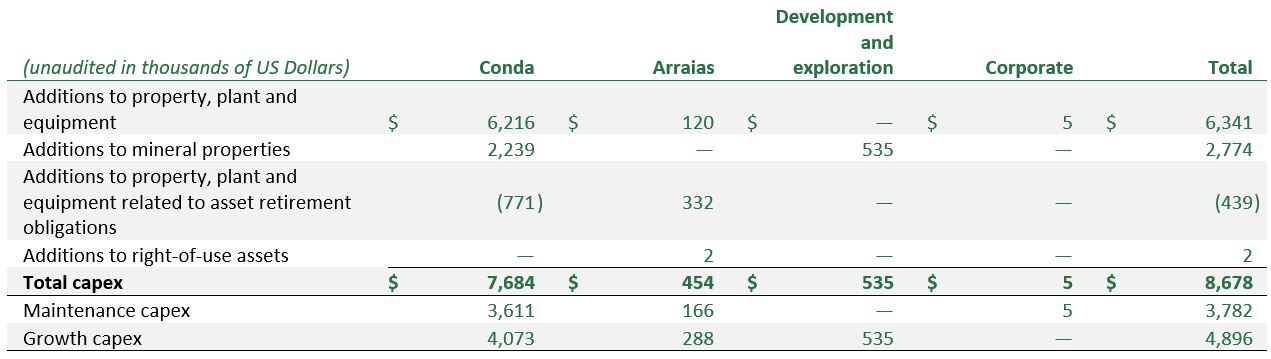
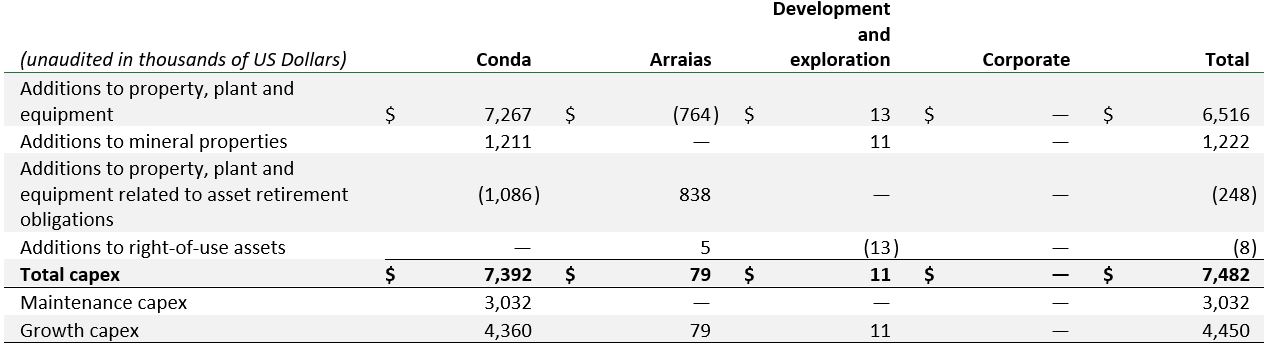
The Company’s total capex(2) spend in Q3 2022 was $8.7 million compared to $7.5 million in Q3 2021 with the increase primarily due to timing of maintenance projects at Conda and maintenance activities at Arraias related to the restart of the sulfuric acid plant which were partially offset by timing of the activities related to the H1/NDR at Conda.
9M 2022 Financial Highlights
For the 9M 2022, the Company’s financial highlights were as follows:
- revenues of $458 million in 9M 2022 compared to $296.5 million in 9M 2021;
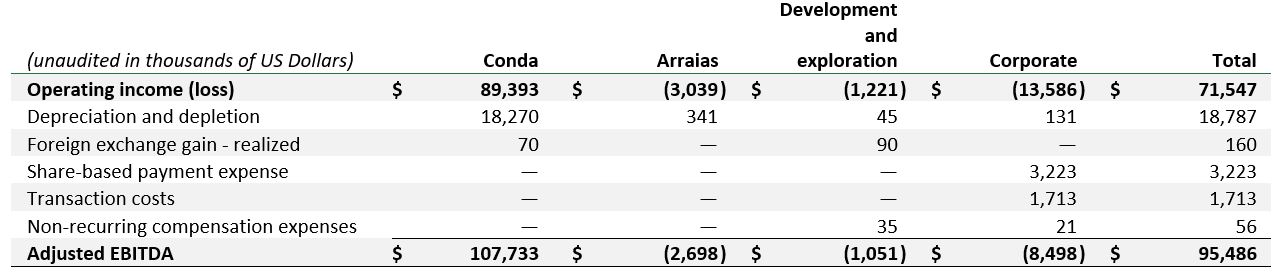
- adjusted EBITDA of $174.6 million in 9M 2022 compared to $95.5 million in 9M 2021;
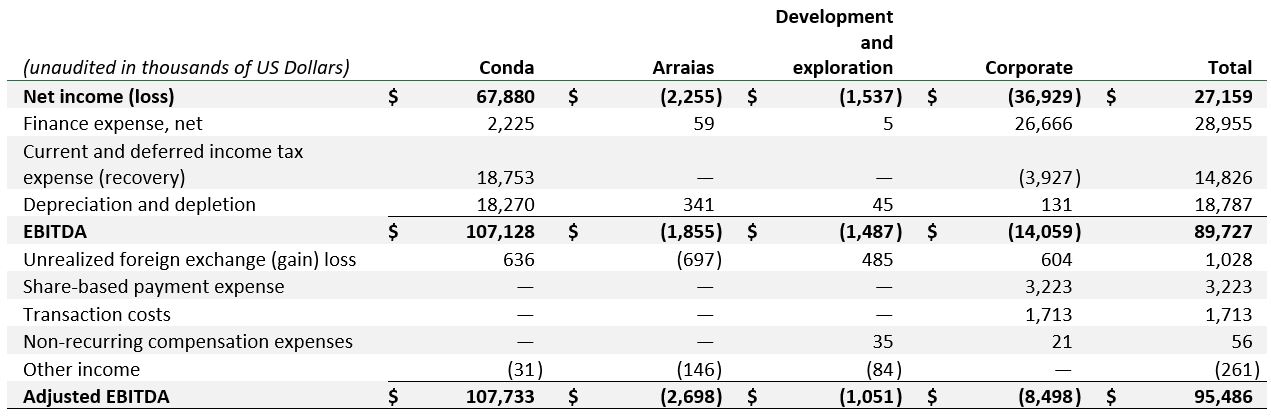
- net income of $85.4 million in 9M 2022 compared to $27.2 million in 9M 2021;
- basic earnings of C$0.58/share in 9M 2022 compared to C$0.18/share in 9M 2021; and
- free cash flow of $149.2 million in 9M 2022 compared to $42.4 million in 9M 2021.
The increase in the Company’s 9M 2022 financial performance compared to 9M 2021 was primarily due to higher realized prices and sales volumes at Conda, which were partially offset by higher input costs, and the restart of the sulfuric acid plant at Arraias.
The Company’s total capex spend in 9M 2022 was $30.0 million compared to $28.5 million in 9M 2021 with the increase primarily due to activities related to the initiative to produce and sell HFSA at Conda and maintenance activities at Arraias related to the restart of the sulfuric acid plant, which were partially offset by a shorter turnaround at Conda in 2022 compared to 2021.
Debt Refinancing
On September 22, 2022, the Company entered into two three-year credit facilities (the “Credit Facilities”) with a syndicate of lenders pursuant to which the lenders have advanced (i) an $85.0 million term loan (the “Term Loan”) to the Company and made available a $35.0 million letter of credit facility (the “LC Facility”) and (ii) an $80.0 million asset-based revolving credit facility (the “ABL Facility”). The proceeds of the Term Loan and ABL Facility were used to refinance the Company’s indebtedness under the existing secured term loan (the “2021 Term Loan”), Conda’s secured working capital facility (the “Conda ABL”), the Company’s unsecured and subordinated promissory note (the “Promissory Note”), the Canadian Debentures and to pay related transaction costs and fees. The refinancing provided for the retirement of all related party debt. Proceeds from the ABL Facility will also be used for working capital and general corporate purposes.
September 30, 2022 Highlights
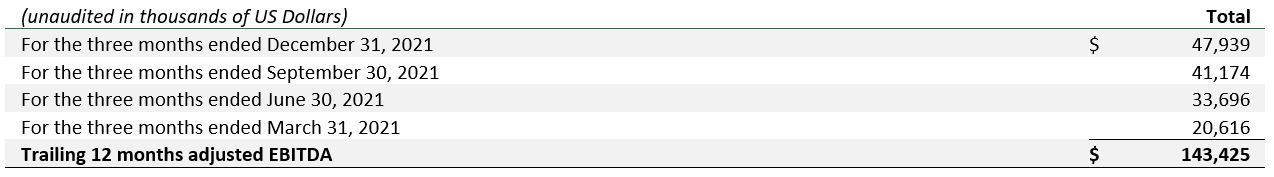
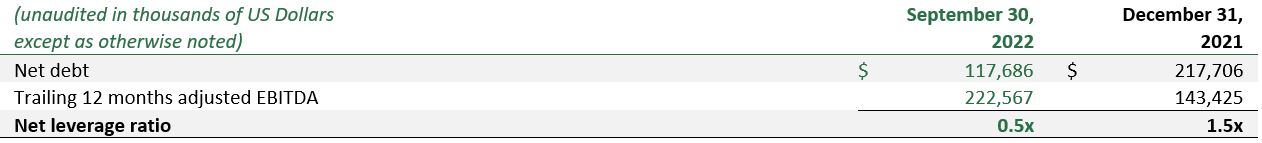
As at September 30, 2022, the Company had trailing 12 months adjusted EBITDA of $222.6 million compared to $143.4 million at the end of 2021 with the increase primarily due to the same factors that resulted in higher adjusted EBITDA in 9M 2022.
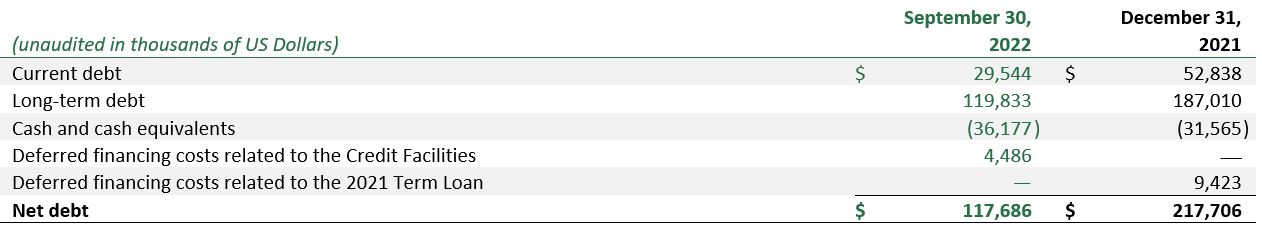
Also as at September 30, 2022, the Company had net debt of $117.7 million compared to $217.7 million at the end of 2021 with the decrease primarily due to the repayment of principal debt outstanding from free cash flows generated and the closing of the Term Loan and ABL Facility, which proceeds were used to refinance the 2021 Term Loan, the Promissory Note, the Conda ABL and the Canadian debentures and higher cash and cash equivalents. The Company’s net debt as at September 30, 2022 was comprised of $36.2 million in cash and $153.9 million in debt (gross of deferred financing costs). As at September 30, 2022, the Company’s net leverage ratio was 0.5x compared to 1.5x at the end of 2021.
As at September 30, 2022, the Company had liquidity(3) of $50.8 million comprised of $36.2 million in cash and $14.6 million in ABL Facility undrawn borrowing capacity.
Q3 2022 Operational Highlights
EHS
- sustained EHS excellence, including no reportable environmental releases and no recordable incidents, which resulted in a consolidated TRIFR of 0.12, representing a new Company record;
- achieved one year without a recordable incident at Conda; and
- continued corporate-wide risk mitigation measures to address potential impacts to employees, contractors and operations as a result of the COVID-19 pandemic, which resulted in no material impact to operations.
Conda
- produced 84,908 tonnes P2O5 at Conda in Q3 2022 compared to 89,220 tonnes P2O5 in Q3 2021 with decrease primarily due to lower throughput;
- generated revenues of $145,274 at Conda in Q3 2022 compared to $103,005 in Q3 2021 with the increase primarily due to higher realized prices and sales volumes;
- generated adjusted EBITDA at Conda of $54,242 in Q3 2022 compared to $45,864 in Q3 2021 with the increase primarily due to the same factors that resulted in higher revenues, which were partially offset by higher input costs;
- advanced activities related to the extension of Conda’s mine life through permitting and development of H1/NDR, including progression of the NEPA EIS preparation and public engagement process; and
- completed first full quarter of HFSA production and sales in Q3 2022 after commencing production and sales of HFSA at the end of Q2 2022.
9M 2022 Operational Highlights
EHS
- sustained EHS excellence, including no reportable environmental releases and one recordable incident, which resulted in a consolidated TRIFR of 0.12, representing a new Company record;
- achieved one year without a recordable incident at Conda;
- received national recognition during the 87th North American Wildlife and Natural Resources Conference as the BLM awarded the Conservation Leadership Partner Award to the Southeast Idaho Habitat Mitigation Fund, which was developed and funded by Conda;
- continued corporate-wide risk mitigation measures to address potential impacts to employees, contractors and operations as a result of the COVID-19 pandemic, which resulted in no material impact to operations; and
- received a notice of violation (“NOV”) at Conda from the from the Idaho Department of Environmental Quality (“DEQ”) related to a failed air stack emissions test in May 2021. Conda investigated and corrected the issues during 2021. The NOV was formally received from the DEQ in May 2022 and resolved in July 2022.
Conda
- completed a scheduled plant turnaround at Conda and returned to full production capacity;
- produced 254,300 tonnes P2O5 at Conda in 9M 2022 compared to 246,411 tonnes P2O5 in 9M 2021 with the increase primarily due to a shorter turnaround in 2022 compared to 2021;
- generated revenues of $441,744 at Conda in 9M 2022 compared to $296,463 in 9M 2021 primarily due to higher realized prices;
- generated adjusted EBITDA at Conda of $185,346 in 9M 2022 compared to $107,733 in 9M 2021 primarily due to the same factors that resulted in higher revenues, which were partially offset by higher input costs;
- reached a settlement with insurers on a business interruption claim related to the 2020 disruption in sulfuric acid supply to Conda, which resulted in receipt of net insurance proceeds of $8,675;
- reached a settlement agreement related to shared environmental and asset retirement obligations at Conda’s Lanes Creek mine;
- purchased mining equipment at Conda in exchange for a note payable of $3,930;
- advanced activities related to the extension of Conda’s mine life through permitting and development of H1/NDR, including progression of the NEPA EIS preparation and public engagement process; and
- advanced activities related to the optimization of Conda’s EBITDA generation, including beginning production and sales of HFSA.
Q3 Other Highlights
- produced 32,935 tonnes of sulfuric acid at Arraias in Q3 2022 compared to no production in Q3 2021;
- generated adjusted EBITDA at Arraias of $182 in Q3 2022 compared to $(926) in Q3 2021 with the increase due to the restart of the sulfuric acid plant;
- continued evaluation of strategic alternatives for non-North American assets; and
- announced the appointment of Matthew O’Neill as CFO. Mr. O’Neill succeeds George Burdette who served as CFO since April 2018.
9M 2022 Other Highlights
- produced 63,135 tonnes of sulfuric acid at Arraias in 9M 2022 compared to no production in 9M 2021;
- generated adjusted EBITDA at Arraias of $(66) in 9M 2022 compared to $(2,698) in 9M 2021 with the reduced deficit due to the restart of the sulfuric acid plant;
- continued evaluation of strategic alternatives for non-North American assets;
- announced the appointment of Stephen Shapiro and Isaiah Toback to the Company’s Board of Directors. Mr. Toback replaced Rory O’Neill as a nominee to the Company’s Board of Directors by its principal shareholder, CLF; and
- announced the appointment of Matthew O’Neill as CFO. Mr. O’Neill succeeds George Burdette who served as CFO since April 2018.
Subsequent Events
Subsequent to September 30, 2022, the Company issued 98,412 shares (net of 63,850 shares withheld to pay applicable taxes) due to vesting under its RSU Plan.
Market Outlook
The Company expects the current strength in global agriculture and phosphate fertilizer fundamentals to continue. Accordingly, the Company expects continued durability in pricing and volume fundamentals in the phosphate fertilizer markets through 2023 relative to 9M 2022.
Specific factors the Company expects to support the continued strength in the global phosphate fertilizer markets through 2023 are as follows:
- no significant phosphate supply capacity additions
- sustained crop prices
- improved phosphate application following historically high pricing; and
- ongoing phosphate export restrictions from China.
The Company expects the sulfur and sulfuric acid market to remain soft globally through 2023 due to increased refinery activity and softer demand from phosphate producers and metals consumers.
Financial Outlook
The Company maintained its guidance for 2022 as follows:

Business Outlook
The Company continues to focus on the following key objectives to drive long-term value and shareholder returns:
- improving financial and operational performance;
- deleveraging the balance sheet;
- extending Conda’s current mine life through permitting and development of H1/NDR;
- evaluating strategic alternatives for non-North American assets; and
- maintaining capital-lite investment approach.
About Itafos
The Company is a phosphate and specialty fertilizer company. The Company’s businesses and projects are as follows:
- Conda – a vertically integrated phosphate fertilizer business located in Idaho, US with production capacity as follows:
- approximately 550kt per year of monoammonium phosphate (“MAP”), MAP with micronutrients (“MAP+”), superphosphoric acid (“SPA”), merchant grade phosphoric acid (“MGA”) and ammonium polyphosphate (“APP”); and
- approximately 27kt per year of hydrofluorosilicic acid (“HFSA”);
- Arraias – a vertically integrated phosphate fertilizer business located in Tocantins, Brazil with production capacity as follows:
- approximately 500kt per year of single superphosphate (“SSP”) and SSP with micronutrients (“SSP+”); and
- approximately 40kt per year of excess sulfuric acid (220kt per year gross sulfuric acid production capacity);
- Farim – a high-grade phosphate mine project located in Farim, Guinea-Bissau;
- Santana – a vertically integrated high-grade phosphate mine and fertilizer plant project located in Pará, Brazil; and
- Araxá – a vertically integrated rare earth elements and niobium mine and extraction plant project located in Minas Gerais, Brazil.
In addition to the businesses and projects described above, the Company also owns Paris Hills (Idaho, US) and Mantaro (Junin, Peru), which are phosphate mine projects that are in process of being wound down.
The Company is a Delaware corporation that is headquartered in Houston, TX. The Company’s shares trade on the TSX Venture Exchange (“TSX-V”) under the ticker symbol “IFOS”. The Company’s principal shareholder is CL Fertilizers Holding LLC (“CLF”). CLF is an affiliate of Castlelake, L.P., a global private investment firm.
For more information, or to join the Company’s mailing list to receive notification of future news releases, please visit the Company’s website at www.itafos.com.
Other Defined Terms
Other defined terms included in this news release are as follows:
- Bureau of Land Management (“BLM”);
- Coronavirus disease 2019 (“COVID-19”);
- Diammonium phosphate (“DAP”) New Orleans (“NOLA”);
- Environmental, Health and Safety (“EHS”);
- Environmental Impact Statement (“EIS”);
- Husky 1/North Dry Ridge (“H1/NDR”);
- International Financial Reporting Standards (“IFRS”);
- National Environmental Policy Act (“NEPA”); and
- Total recordable incident frequency rate (“TRIFR”).
Forward-Looking Information
Certain information contained in this news release constitutes forward-looking information. All information other than information of historical fact is forward-looking information. Statements that address activities, events or developments that the Company believes, expects or anticipates will or may occur in the future include, but are not limited to, statements regarding estimates and/or assumptions in respect of the Company’s financial and business outlook are forward-looking information. The use of any of the words “intend”, “anticipate”, “plan”, “continue”, “estimate”, “expect”, “may”, “will”, “project”, “should”, “would”, “believe”, “predict” and “potential” and similar expressions are intended to identify forward-looking information. This information involves known and unknown risks, uncertainties and other factors that may cause actual results or events to differ materially from those anticipated in such forward-looking information. No assurance can be given that this information will prove to be correct and such forward-looking information included in this news release should not be unduly relied upon.
Forward-looking information is subject to a number of risks and other factors that could cause actual results and events to vary materially from that anticipated by such forward-looking information. Although the Company has attempted to identify important factors that could cause actual results to differ materially from those contained in forward-looking statements, there may be other factors that cause results not to be as anticipated, estimated or intended. Factors that may cause actual results to differ materially from expected results described in forward-looking statements include, but are not limited to, uncertainties of estimates of capital and operating costs and production estimates; the ability of the Company to meet its financial obligations and minimum commitments, fund capital expenditures and comply with covenants contained in the agreements that govern indebtedness; fluctuations in foreign exchange or interest rates and stock market volatility; the continued supply of sulfuric acid to Conda from its primary supplier and those risk factors set out in the Company’s annual information form and management’s discussion and analysis of operations and financial condition, each of which are available under the Company’s profile on SEDAR at www.sedar.com and on the Company’s website at www.itafos.com. Readers are cautioned that the foregoing list of risks, uncertainties and assumptions are not exhaustive. The forward-looking information included in this news release is expressly qualified by this cautionary statement and is made as of the date of this news release. The Company undertakes no obligation to publicly update or revise any forward-looking information except as required by applicable securities laws.
This news release contains future oriented financial information and financial outlook information (together, “FOFI”) about the Company’s prospective results of operations, including statements regarding expected adjusted EBITDA, net income, basic earnings per share, maintenance capex, growth capex and free cash flow. FOFI is subject to the same assumptions, risk factors, limitations and qualifications as set forth in the above paragraph. The Company has included the FOFI to provide an outlook of management’s expectations regarding anticipated activities and results, and such information may not be appropriate for other purposes. The Company and management believe that the FOFI has been prepared on a reasonable basis, reflecting management’s reasonable estimates and judgements; however, actual results of operations and the resulting financial results may vary from the amounts set forth herein. Any financial outlook information speaks only as of the date on which it is made and the Company undertakes no obligation to publicly update or revise any financial outlook information except as required by applicable securities laws.
NEITHER THE TSX-V NOR ITS REGULATION SERVICES PROVIDER (AS THAT TERM IS DEFINED IN THE POLICIES OF THE TSX-V) ACCEPTS RESPONSIBILITY FOR THE ADEQUACY OR ACCURACY OF THIS NEWS RELEASE.
For further information, please contact:
Matthew O’Neill
Itafos Investor Relations
investor@itafos.com
713-242-8446
Non-IFRS Financial Measures
This press release contains both IFRS and certain non-IFRS measures that management considers to evaluate the Company’s operational and financial performance. Non-IFRS measures are a numerical measure of a company’s performance, that either include or exclude amounts that are not normally included or excluded from the most directly comparable IFRS measures. Management believes that the non-IFRS measures provide useful supplemental information to investors, analysts, lenders and others. In evaluating non-IFRS measures, investors, analysts, lenders and others should consider that non-IFRS measures do not have any standardized meaning under IFRS and that the methodology applied by the Company in calculating such non-IFRS measures may differ among companies and analysts. Non-IFRS measures should not be considered as a substitute for, nor superior to, measures of financial performance prepared in accordance with IFRS. Definitions and reconciliations of non-IFRS measures to the most directly comparable IFRS measures are included below.
DEFINITIONS
The Company defines its non-IFRS measures as follows:
| Non-IFRS measure | Definition | Most directly comparable IFRS measure |
| EBITDA | Earnings before interest, taxes, depreciation, depletion and amortization | Net income (loss) and operating income (loss) |
| Adjusted EBITDA | EBITDA adjusted for non-cash, extraordinary, non-recurring and other items unrelated to the Company’s core operating activities | Net income (loss) and operating income (loss) |
| Trailing 12 months adjusted EBITDA | Adjusted EBITDA for the current and preceding three quarters | Net income (loss) and operating income (loss) for the current and preceding three quarters |
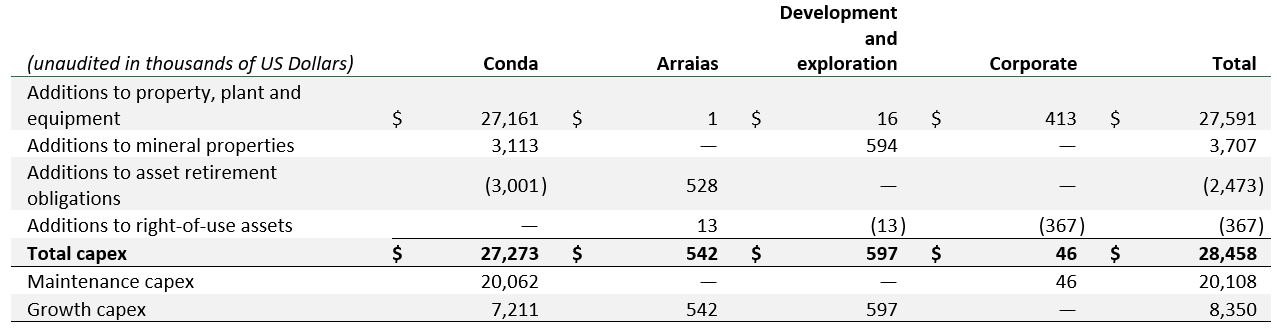
| Total capex | Additions to property, plant, and equipment and mineral properties adjusted for additions to asset retirement obligations, additions to right-of-use assets and capitalized interest | Additions to property, plant and equipment and mineral properties |
| Maintenance capex | Portion of total capex relating to the maintenance of ongoing operations | Additions to property, plant and equipment and mineral properties |
| Growth capex | Portion of total capex relating to the development of growth opportunities | Additions to property, plant and equipment and mineral properties |
| Net debt | Debt less cash and cash equivalents plus deferred financing costs (does not consider lease liabilities) | Current debt, long-term debt and cash and cash equivalents |
| Net leverage ratio | Net debt divided by trailing 12 months adjusted EBITDA | Current debt, long-term debt and cash and cash equivalents; net income (loss) and operating income (loss) for the current and preceding three quarters |
| Liquidity | Cash and cash equivalents plus undrawn committed borrowing capacity | Cash and cash equivalents |
| Free cash flow | Cash flows from operating activities, which excludes payment of interest expense, plus cash flows from investing activities less cash growth capex | Cash flows from operating activities and cash flows from investing activities |
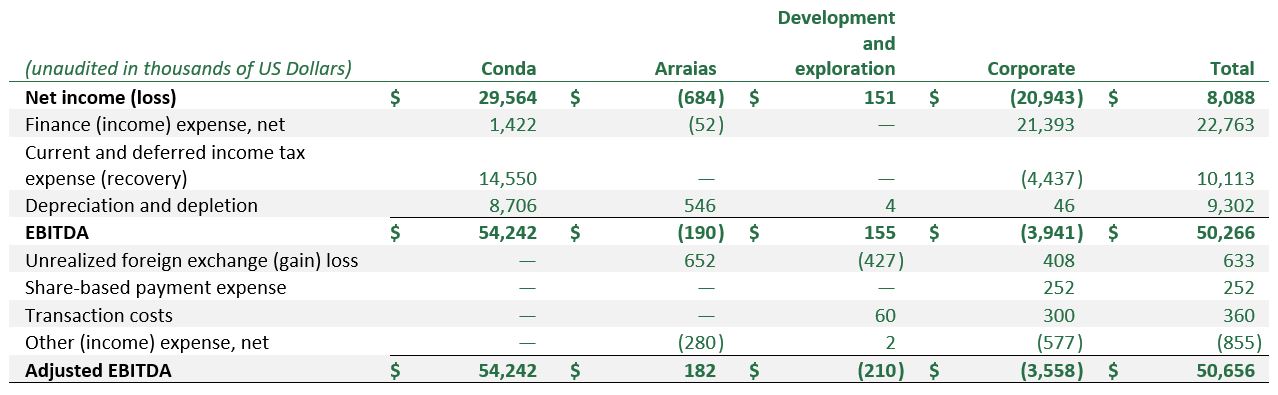
EBITDA, ADJUSTED EBITDA AND TRAILING 12 MONTHS ADJUSTED EBITDA
EBITDA is a non-IFRS measure that excludes interest, taxes, depreciation, depletion and amortization from earnings. Management believes that EBITDA is a valuable indicator of the Company’s ability to generate operating income.
Adjusted EBITDA is a non-IFRS measure that excludes non-cash, extraordinary, non-recurring and other items unrelated to the Company’s core operating activities from EBITDA (non-IFRS measure). Management believes that adjusted EBITDA is a valuable indicator of the Company’s ability to generate operating income from its core operating activities normalized to remove the impact of non-cash, extraordinary and non-recurring items. The Company provides guidance on adjusted EBITDA as useful supplemental information to investors, analysts, lenders and others.
Trailing 12 months adjusted EBITDA is a non-IFRS measure that includes adjusted EBITDA (non-IFRS measure) for the current and preceding three quarters.
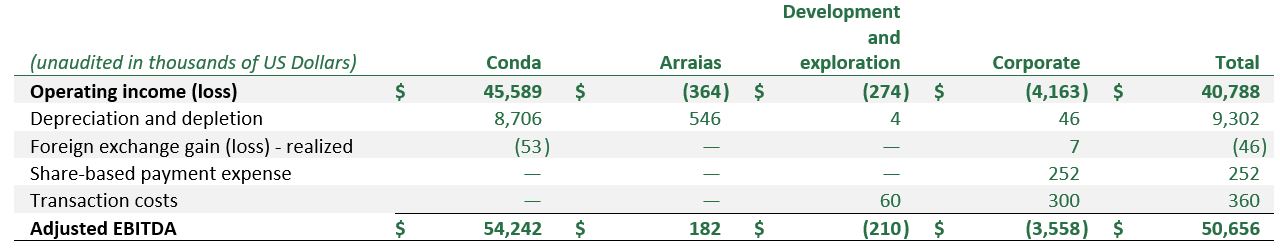
For the three months ended September 30, 2022 and 2021
For the three months ended September 30, 2022, the Company had EBITDA and adjusted EBITDA by segment as follows:
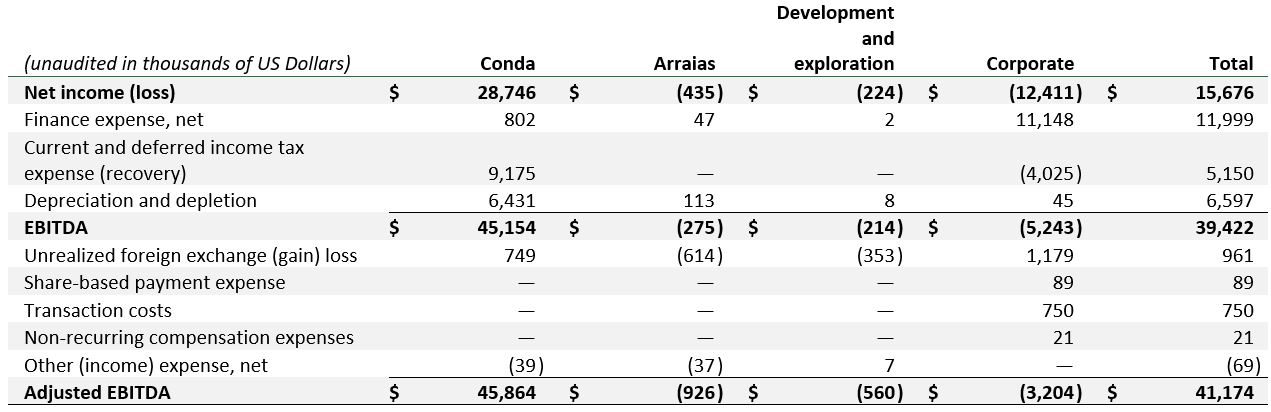
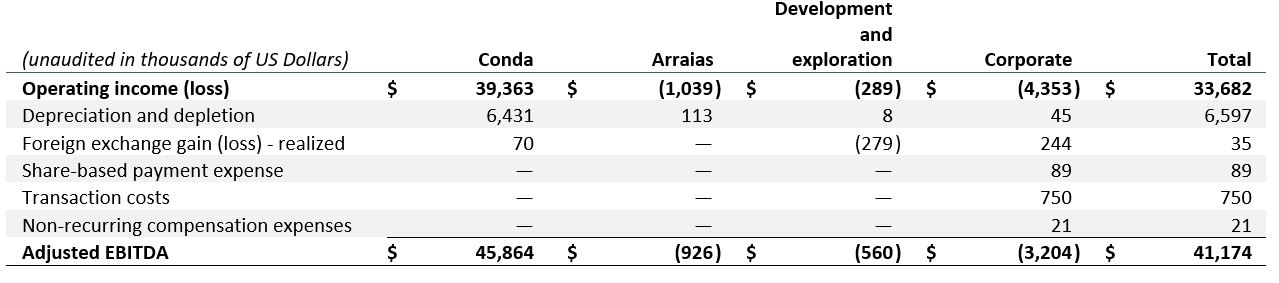
For the three months ended September 30, 2021, the Company had EBITDA and adjusted EBITDA by segment as follows:
For the nine months ended September 30, 2022 and 2021
For the nine months ended September 30, 2022, the Company had EBITDA and adjusted EBITDA by segment as follows:

For the nine months ended September 30, 2021, the Company had EBITDA and adjusted EBITDA by segment as follows:
As at September 30, 2022 and December 31, 2021
As at September 30, 2022, the Company had trailing 12 months adjusted EBITDA as follows:
As at December 31, 2021, the Company had trailing 12 months adjusted EBITDA as follows:
TOTAL CAPEX
Total capex is a non-IFRS measure that includes additions to property, plant, and equipment and mineral properties, which are adjusted for additions to asset retirement obligations, additions to right-of-use assets and capitalized interest.
Maintenance capex is a non-IFRS measure that includes the portion of total capex (non-IFRS measure) relating to the maintenance of ongoing operations. Management believes that maintenance capex is a valuable indicator of the Company’s required capital expenditures to sustain operations at existing levels.
Growth capex is a non-IFRS measure that includes the portion of total capex (non-IFRS measure) relating to the development of growth opportunities. Management believe that growth capex is a valuable indicator of the Company’s capital expenditures related to growth opportunities.
The Company provides guidance on both maintenance capex and growth capex as useful supplemental information to investors, analysts, lenders and others.
For the three months ended September 30, 2022 and 2021
For the three months ended September 30, 2022, the Company had capex by segment as follows:
For the three months ended September 30, 2021, the Company had capex by segment as follows:
For the nine months ended September 30, 2022 and 2021
For the nine months ended September 30, 2022, the Company had capex by segment as follows:
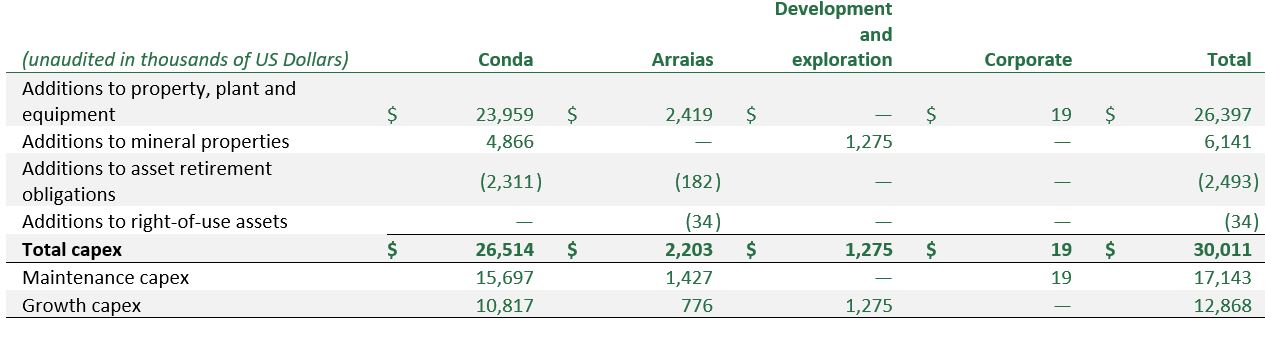
For the nine months ended September 30, 2021, the Company had capex by segment as follows:
NET DEBT and NET LEVERAGE RATIO
Net debt is a non-IFRS measure that includes debt less cash and cash equivalents and excludes deferred financing costs from debt. The Company’s net debt does not include lease liabilities. Management believes that net debt is a valuable indicator of the Company’s net debt position as it removes the impact of deferring financing costs.
Net leverage ratio is a non-IFRS measure that considers net debt (non-IFRS measure) divided by trailing 12 months adjusted EBITDA (non-IFRS measure). Management believes that the Company’s net leverage ratio is a valuable indicator of its ability to service its debt from its core operating activities.
As at September 30, 2022 and December 31, 2021, the Company had net debt as follows:
As at September 30, 2022 and December 31, 2021, the Company’s net leverage ratio was as follows:
LIQUIDITY
Liquidity is a non-IFRS measure that includes cash and cash equivalents plus undrawn committed borrowing capacity. Management believes that liquidity is a valuable indicator of the Company’s liquidity.
As at September 30, 2022 and December 31, 2021, the Company had liquidity as follows:

FREE CASH FLOW
Free cash flow is a non-IFRS measure that includes cash flows from operating activities (which excludes payment of interest expense) and cash flows from investing activities less cash growth capex (non-IFRS measure). Management believes that free cash flow is a valuable indicator of the Company’s ability to generate cash flows from operations after giving effect to required capital expenditures to sustain operations at existing levels. Management further believes that free cash flow is a valuable indicator of the Company’s cash flow available for debt service or to fund growth opportunities. The Company provides guidance on free cash flow as useful supplemental information to investors, analysts, lenders and others.
For three and nine months ended September 30, 2022 and 2021, the Company had free cash flow as follows:
1 Adjusted EBITDA, trailing 12 months adjusted EBITDA, maintenance capex, growth capex, net debt, net leverage ratio and free cash flow are each a non-IFRS financial measure. For additional information on non-IFRS and other financial measures, see “Non-IFRS financial measures” below.
2 Total capex is a non-IFRS financial measure. For additional information on non-IFRS and other financial measures, see “Non-IFRS financial measures” below.
3 Liquidity is a non-IFRS financial measure. For additional information on non-IFRS and other financial measures, see “Non-IFRS financial measures” below.
Itafos Reports Record Q3 and 9M 2022 Results, Confirms Full-Year 2022 Guidance